Note_Tech
All technological notes.
Project maintained by simonangel-fong Hosted on GitHub Pages — Theme by mattgraham
Machine Learning - Hierarchical Clustering
Hierarchical Clustering 分层群聚
Hierarchical clustering: an unsupervised learning method for clustering data points.-
The algorithm builds clusters by measuring the dissimilarities between data.
-
-
Unsupervised learning: a model does not have to be trained, and a “target” variable is not need.- This method can be used on any data to visualize and interpret the relationship between individual data points.
-
Agglomerative Clustering, a type of hierarchical clustering that follows a bottom up approach.-
凝聚(Agglomerative clustering):一种自底向上方法,从小集群开始,逐渐将其合并,形成更大的集群.
-
- treat each data point as its own cluster
-
- join clusters together that have the shortest distance between them to create larger clusters.
- This step is repeated until one large cluster is formed containing all of the data points.
- join clusters together that have the shortest distance between them to create larger clusters.
-
-
Hierarchical clusteringrequires to decide on both a distance and linkage method.- use
euclidean distance(欧氏距离) and theWard linkagemethod, which attempts to minimize the variance between clusters.
- use
Create Dataset
zip(): returns a zip object- Turn the data into a set of points 将两个数据列组合成坐标
x_list = [4, 5, 10, 4, 3, 11, 14, 6, 10, 12]
y_list = [21, 19, 24, 17, 16, 25, 24, 22, 21, 21]

# zip() function returns a zip object
# Turn the data into a set of points 将两个数据列组合成坐标
data = list(zip(x_list, y_list))

print(data)
# [(4, 21), (5, 19), (10, 24), (4, 17), (3, 16), (11, 25), (14, 24), (6, 22), (10, 21), (12, 21)]
Method1: Scipy Library
-
Compute the linkage between all of the different points.
-
using a simple euclidean distance measure and Ward’s linkage, which seeks to minimize the variance between clusters.
-
scipy.cluster.hierarchy.linkage(): Perform hierarchical/agglomerative clustering.method='ward'metric='euclidean'
-
-
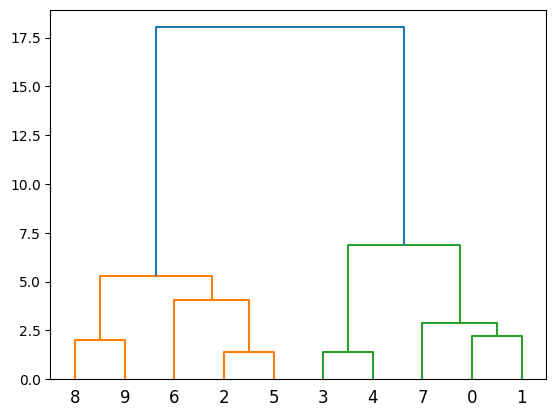
Finally, plot the results in a dendrogram. This plot will show the hierarchy of clusters from the bottom (individual points) to the top (a single cluster consisting of all data points).
scipy.cluster.hierarchy.dendrogram(): Plot the hierarchical clustering as a dendrogram(系统树图(一种表示亲缘关系的树状图解)).
import numpy as np
import matplotlib.pyplot as plt
from scipy.cluster.hierarchy import dendrogram, linkage

# scipy.cluster.hierarchy.linkage():
# Perform hierarchical/agglomerative clustering.
#   Method: method=’ward’ uses the Ward variance minimization algorithm.
#   metric: The distance metric to use in the case that y is a collection of observation vectors;
# return: ndarray, The hierarchical clustering encoded as a linkage matrix.
linkage_data = linkage(data, method='ward', metric='euclidean')

# dendrogram(): Plot the hierarchical clustering as a dendrogram(系统树图(一种表示亲缘关系的树状图解)).
dendrogram(linkage_data)

plt.show()
Method2: Scikit-Learn Library
-
First, initialize the AgglomerativeClustering class with 2 clusters, using the same euclidean distance and Ward linkage.
sklearn.cluster.AgglomerativeClustering(): Agglomerative Clustering.- Recursively merges pair of clusters of sample data; uses linkage distance.
-
The
.fit_predictmethod can be called on data to compute the clusters using the defined parameters across our chosen number of clusters. -
sklearn.cluster.AgglomerativeClustering().fit_predict(): Fit and return the result of each sample’s clustering assignment.- Return the result of the clustering assignment for each sample in the training set.
import matplotlib.pyplot as plt
from sklearn.cluster import AgglomerativeClustering
# AgglomerativeClustering()
# n_clustersint: The number of clusters to find.
# affinity: The metric to use when calculating distance between instances in a feature array.
# linkage: Which linkage criterion to use.
# return: object
hierarchical_cluster = AgglomerativeClustering(
n_clusters=2, affinity='euclidean', linkage='ward')
# Fit and return the result of each sample’s clustering assignment.
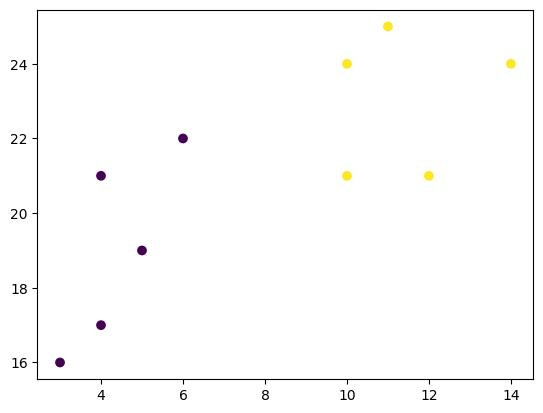
labels = hierarchical_cluster.fit_predict(data) # [0 0 1 0 0 1 1 0 1 1]
plt.scatter(x_list, y_list, c=labels)
plt.show()