Note_Tech
All technological notes.
Project maintained by simonangel-fong Hosted on GitHub Pages — Theme by mattgraham
AWS - CloudWatch
- AWS - CloudWatch
Amazon CloudWatch
- Sample: You have made a configuration change and would like to evaluate the impact of it on the performance of your application. Which AWS service should you use?
- Amazon
CloudWatchis a monitoring service that allows you to monitor your applications, respond to system-wide performance changes, optimize resource utilization, and get a unified view of operational health. It is used to monitor your applications’ performance and metrics.
- Amazon
CloudWatch - Metrics
-
CloudWatchprovides metrics for every services in AWS -
Metric- a variable to monitor (CPUUtilization, NetworkIn…)
Metricsbelong to namespaces(one namespace per service)Metricshave timestamps
- Can create
CloudWatch dashboardsof metrics -
Can create
CloudWatch Custom Metrics(for the RAM for example) -
Dimension- an attribute of a metric (instance id, environment, etc…).
- Up to 30 dimensions per metric
Metric Streams
-
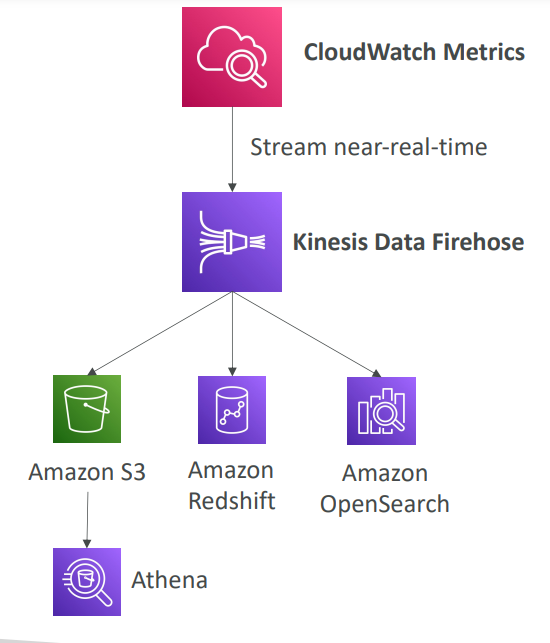
Metric Streams- Continually stream CloudWatch metrics to a destination of your choice, with near-real-time delivery and low latency.
-
Target:
Amazon Kinesis Data Firehose(and then its destinations)- 3rd party service provider:
- Datadog, Dynatrace, New Relic, Splunk, Sumo Logic…
-
Option to filter metrics to only stream a subset of them
- Sample:
- …. is a CloudWatch feature that allows you to send CloudWatch metrics in near real-time to S3 bucket (through Kinesis Data Firehose) and 3rd party destinations (e.g., Splunk, Datadog, …).
- Metric Streams
- …. is a CloudWatch feature that allows you to send CloudWatch metrics in near real-time to S3 bucket (through Kinesis Data Firehose) and 3rd party destinations (e.g., Splunk, Datadog, …).
CloudWatch - Logs
-
Usage:
- used to store application log in AWS.
-
Log groups:
- arbitrary name, usually representing an application
-
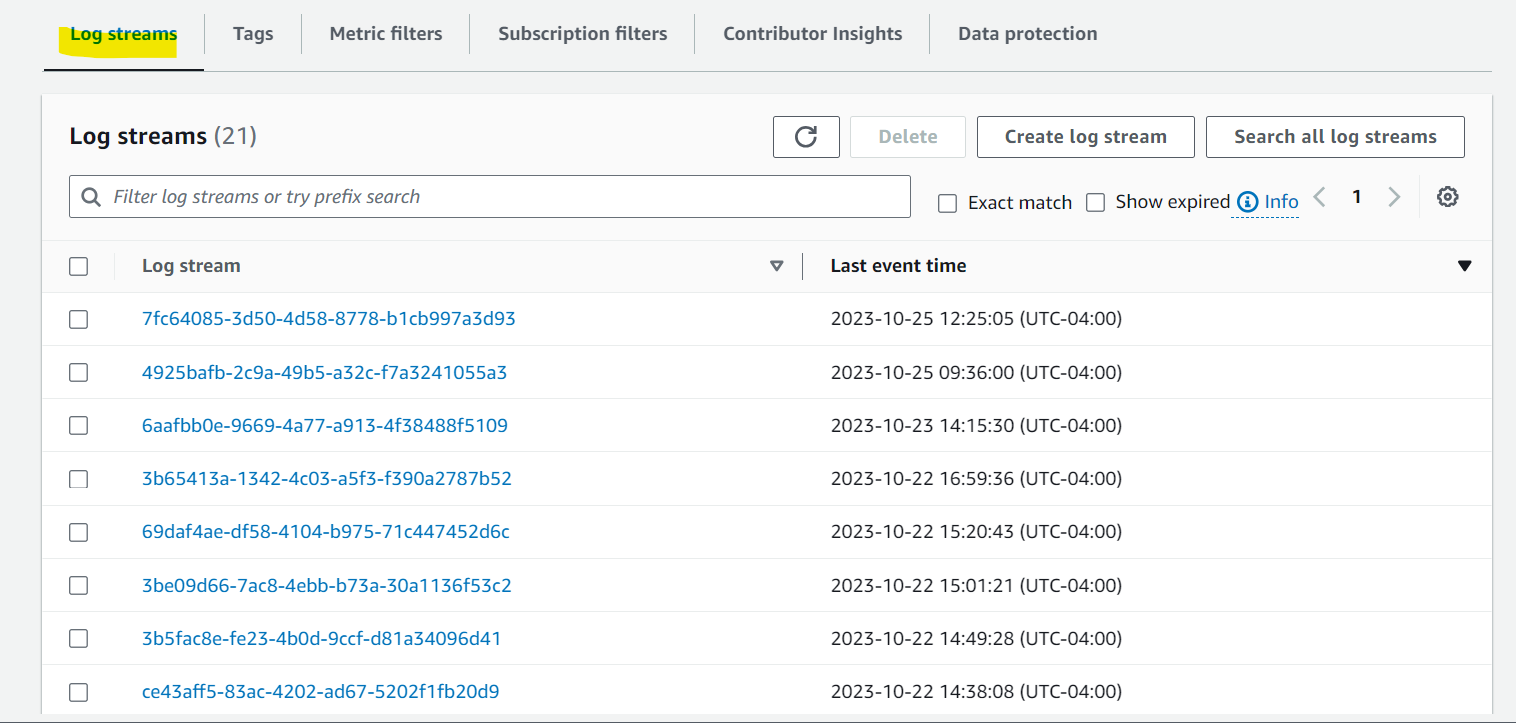
Log stream:
- represent log instances within application / log files / containers
-
CloudWatch
Logscan send logs to:- Amazon
S3(exports) Kinesis Data StreamsKinesis Data Firehose- AWS
Lambda OpenSearch
- Amazon
-
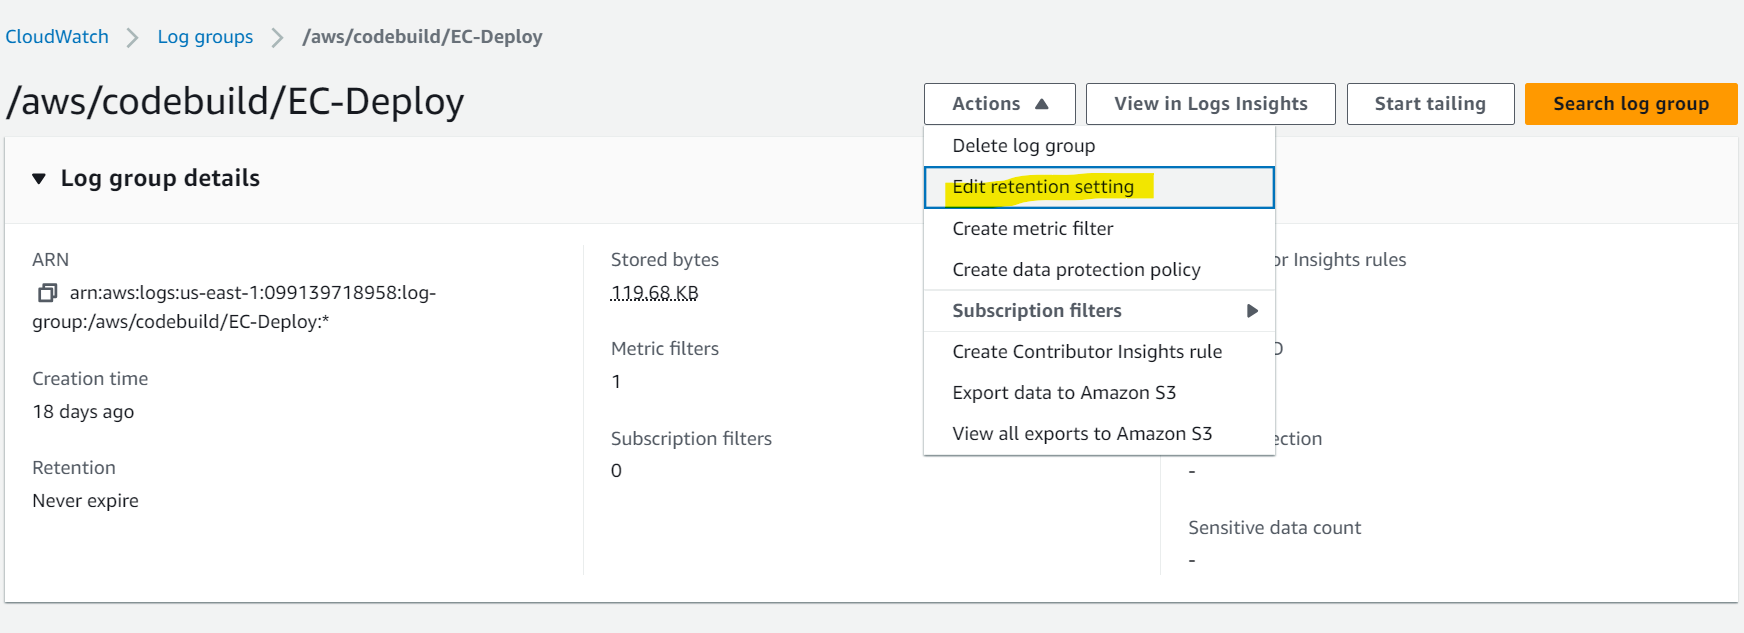
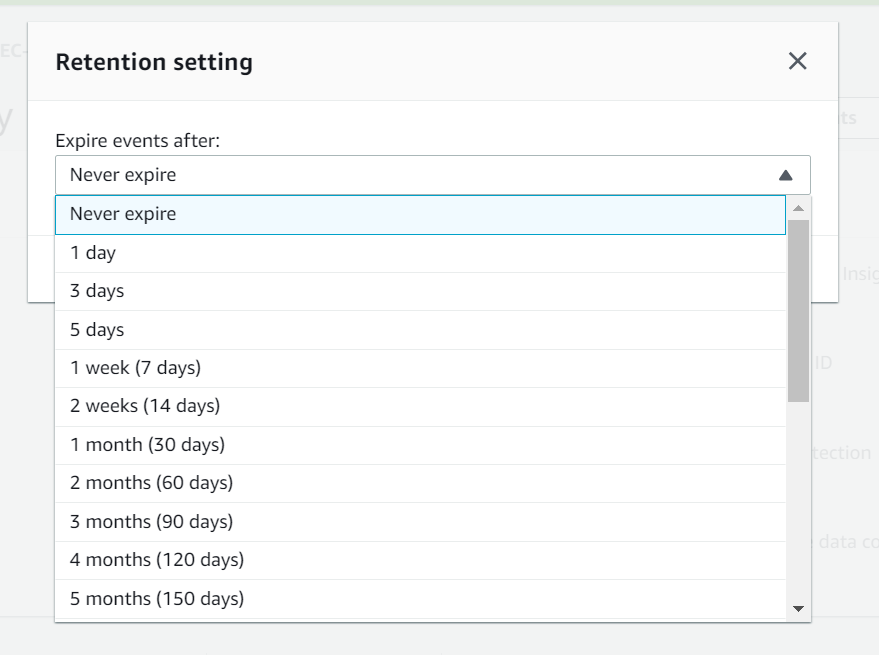
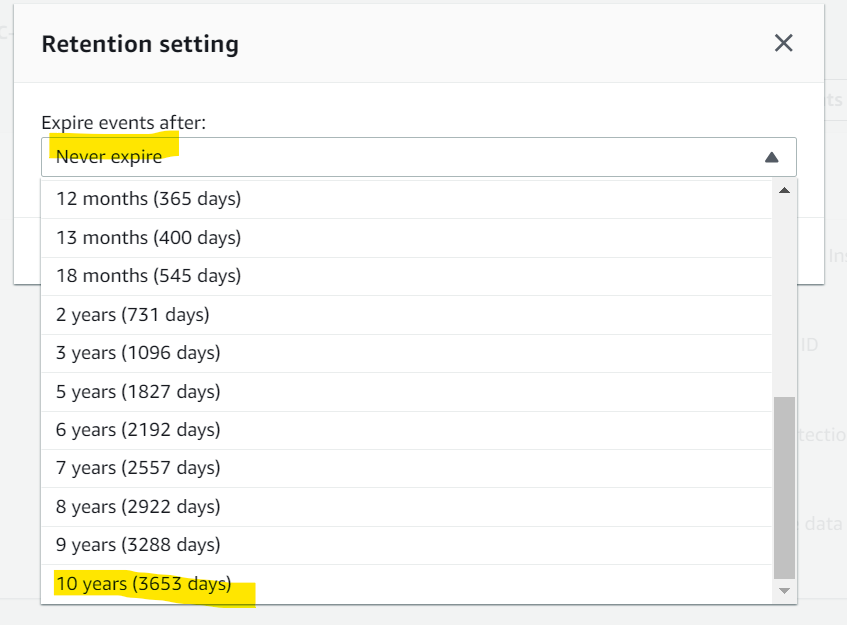
Can define log expiration policies (never expire, 1 day to 10 years…)
-
Security
- Logs are encrypted by default
- Can setup
KMS-basedencryption with your own keys
Sources
- SDK, CloudWatch Logs Agent, CloudWatch Unified Agent
Elastic Beanstalk:- collection of logs from application
ECS:- collection from containers
AWS Lambda:- collection from function logs
VPC Flow Logs:- VPC specific logs
API Gateway:- request record
CloudTrailbased on filterRoute53:- Log DNS queries
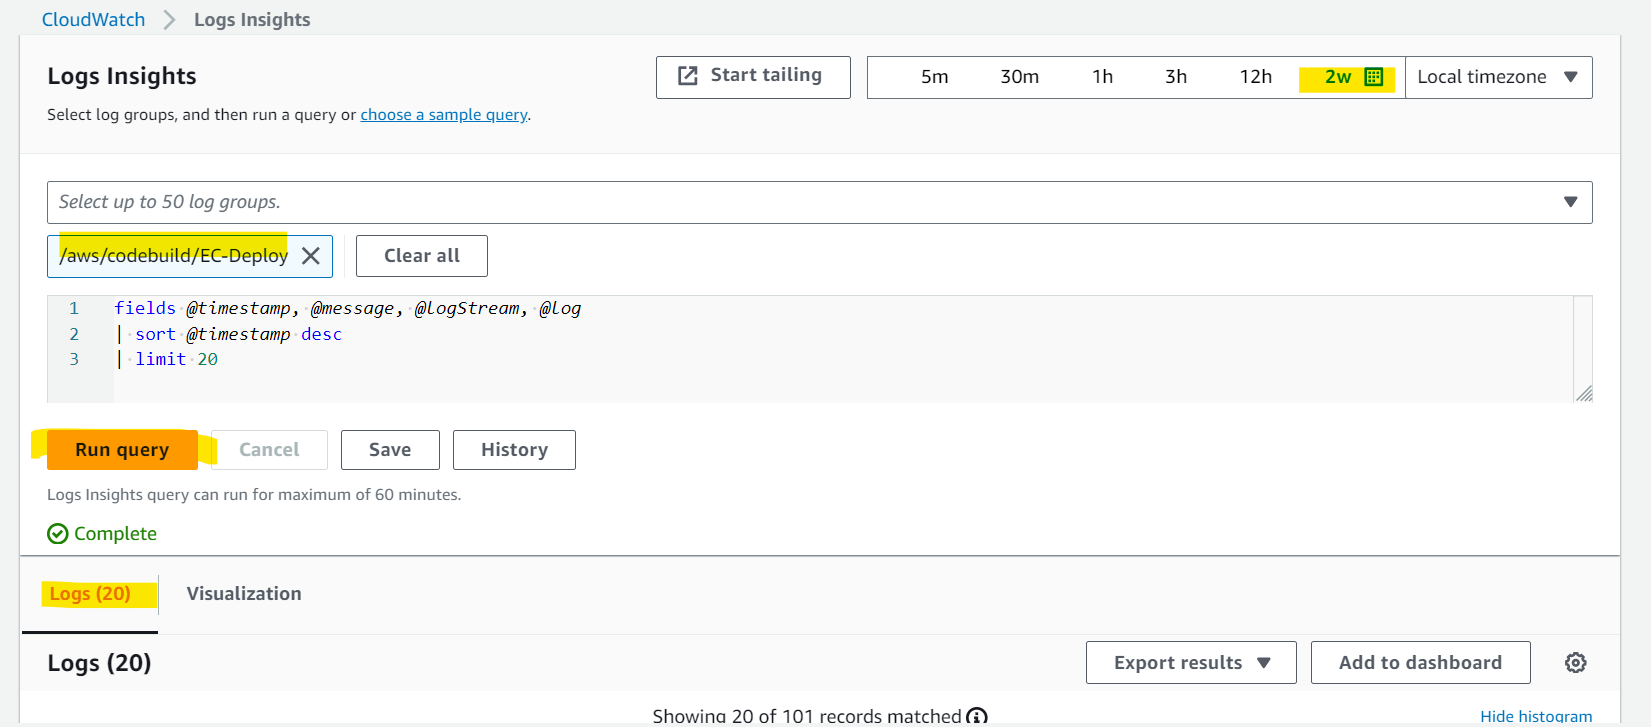
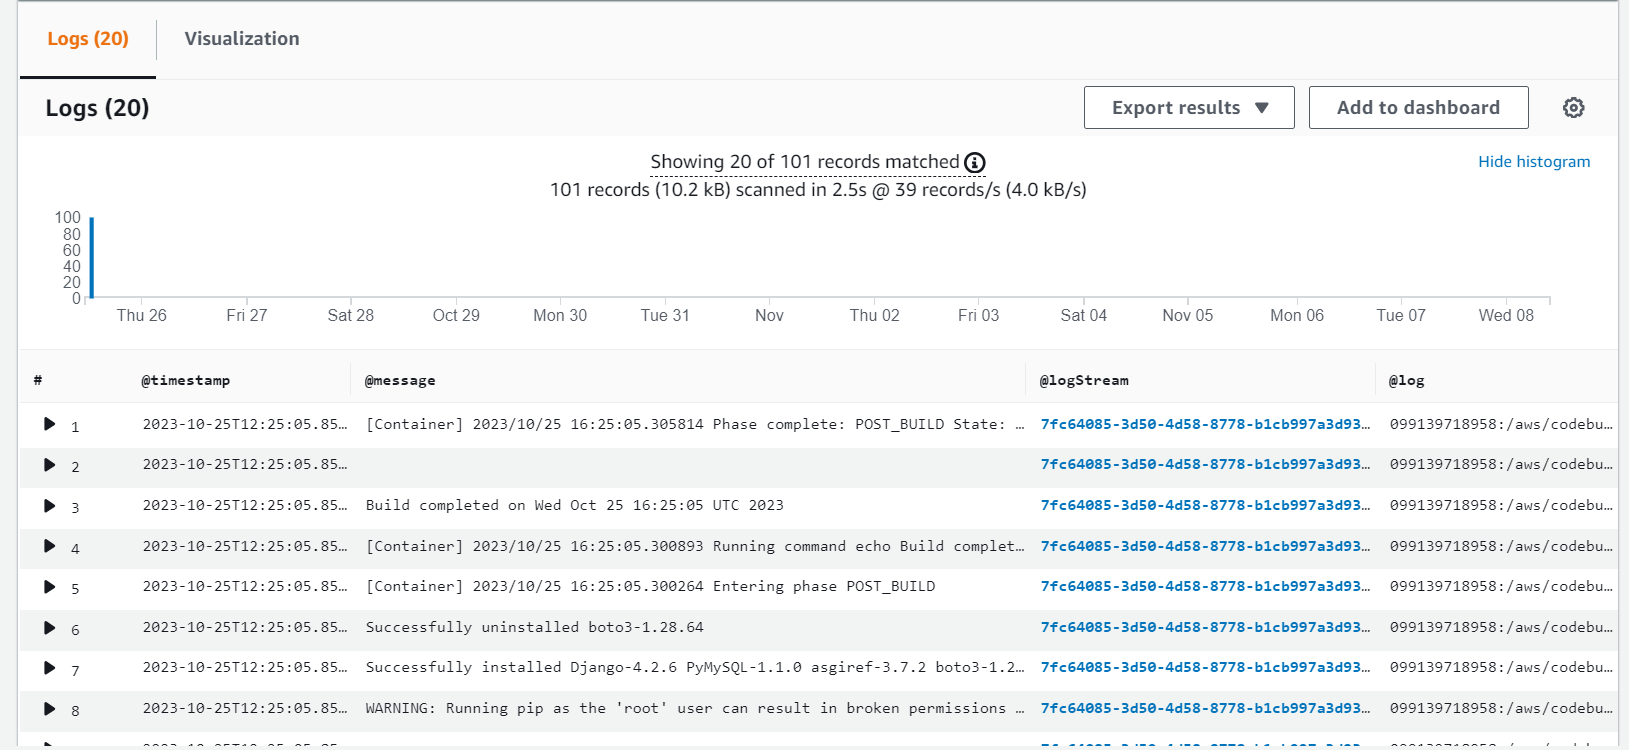
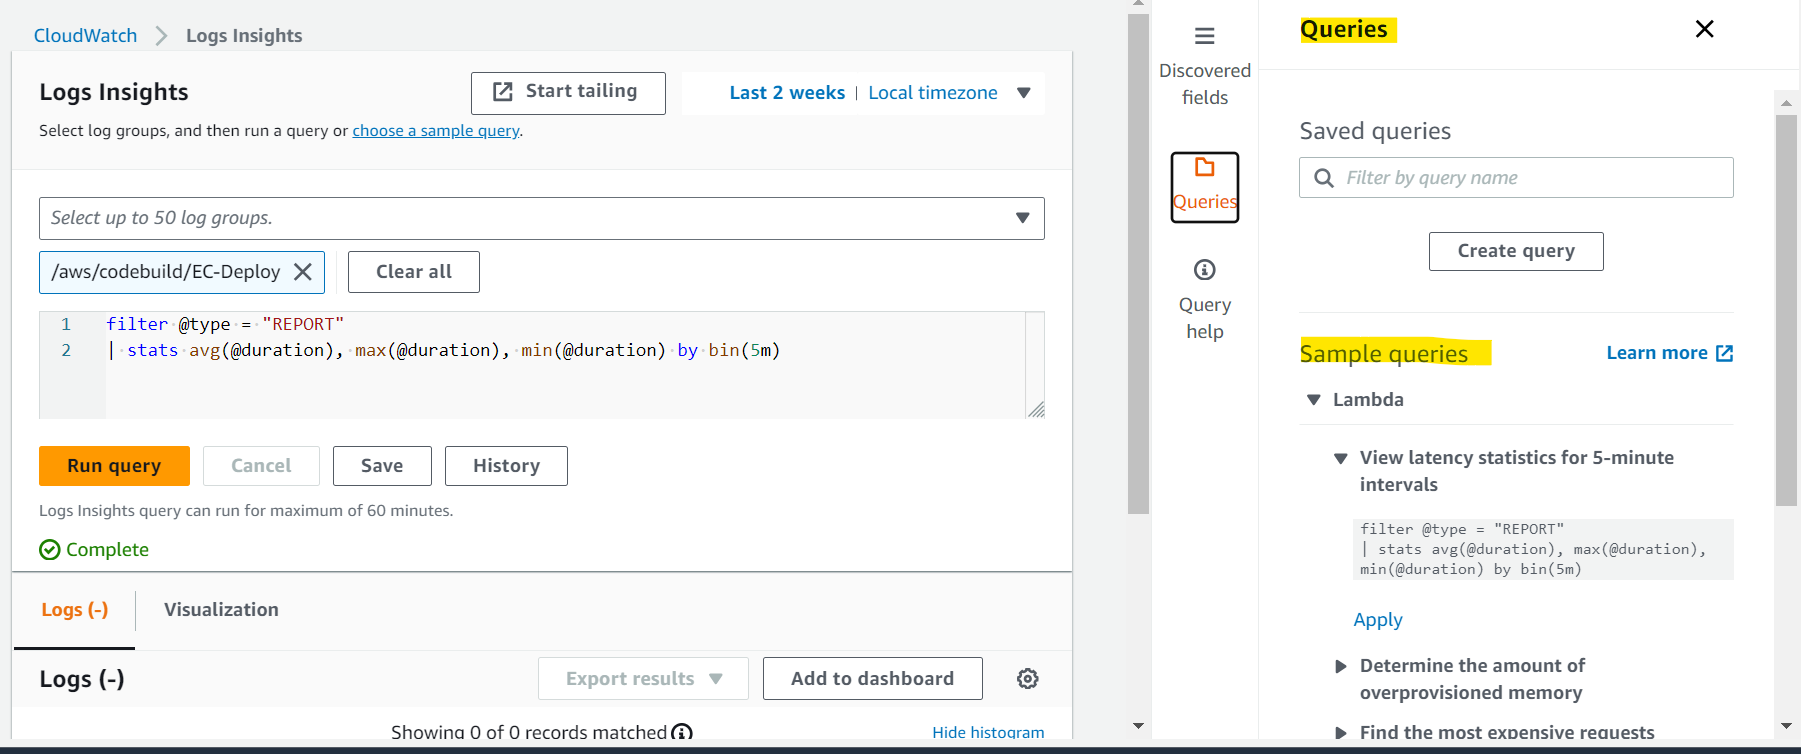
Logs Insights
-
Usage
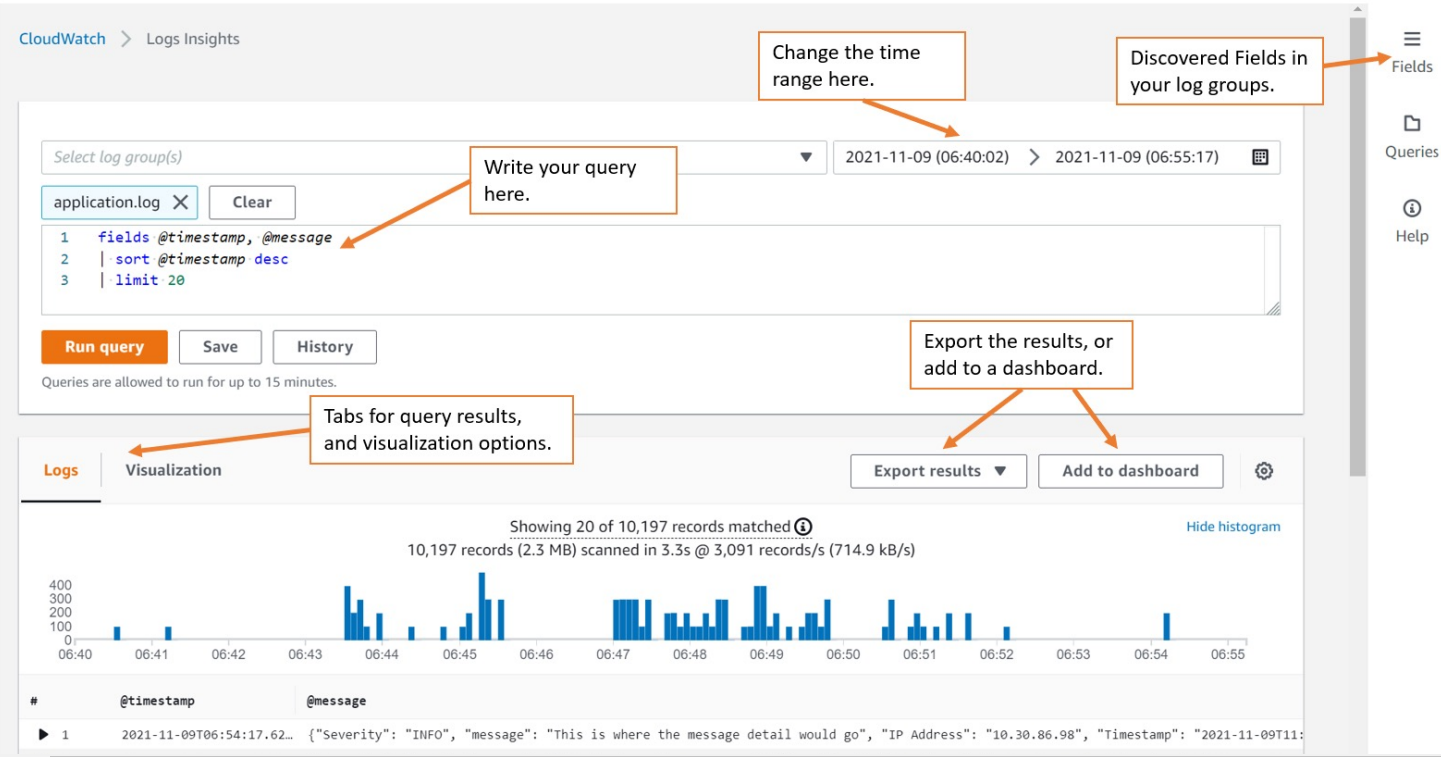
- Search and analyze log data stored in
CloudWatch Logs- ie: find a specific IP inside a log, count occurrences of “ERROR” in your logs…
- Search and analyze log data stored in
-
Provides a purpose-built query language
- Automatically discovers fields from AWS services and JSON log events
- Fetch desired event fields, filter based on conditions, calculate aggregate statistics, sort events, limit number of events…
- Can save queries and add them to
CloudWatch Dashboards
- Can query multiple
Log Groupsin different AWS accounts - It’s a query engine, not a real-time engine, only query historical data.
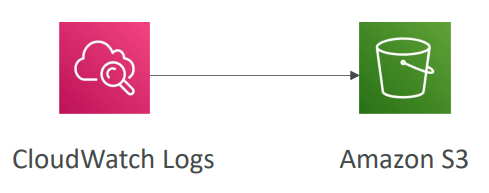
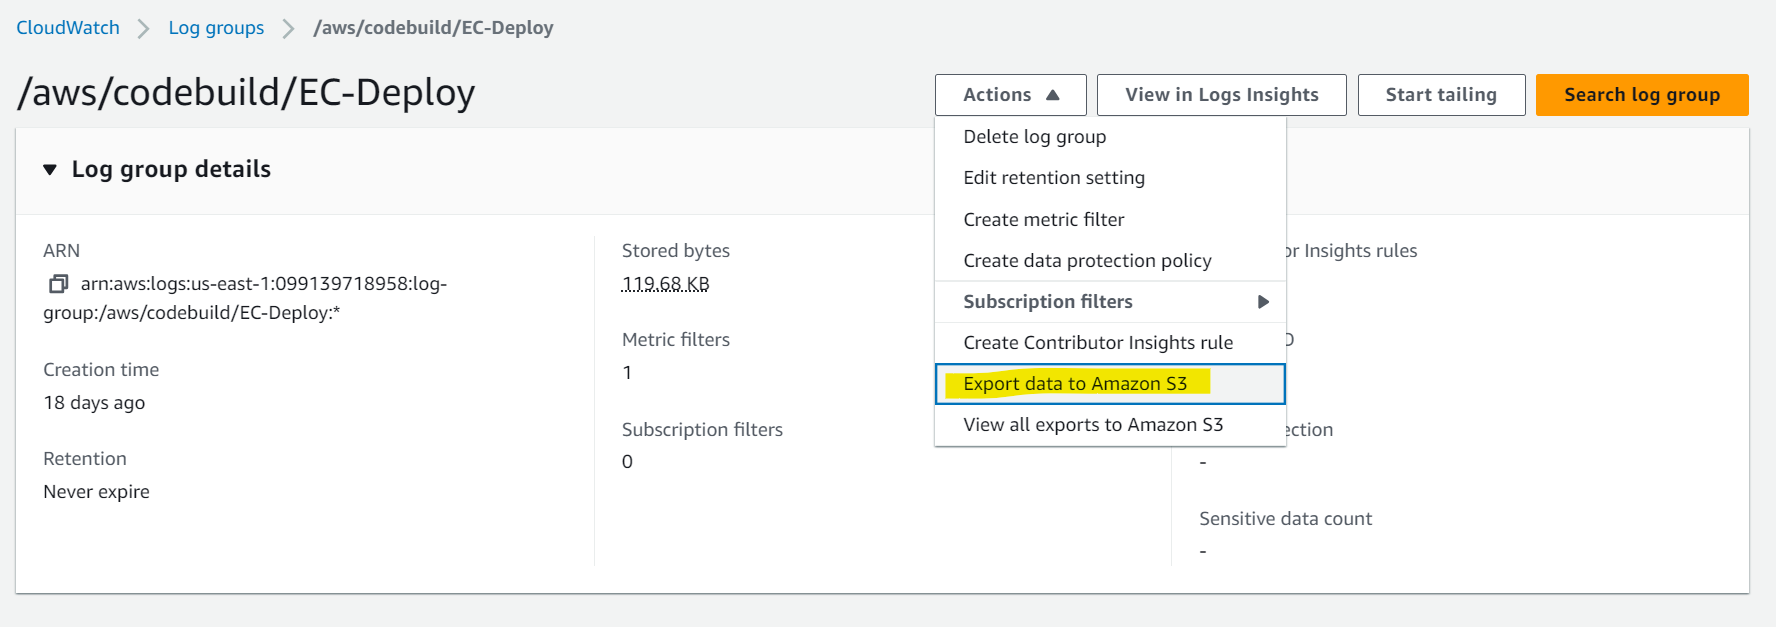
S3 Export
-
Log data can take up to 12 hours to become available for batch export
-
CreateExportTask- the API call used to initiate export
-
a batch export
- Not near-real time or real-time…
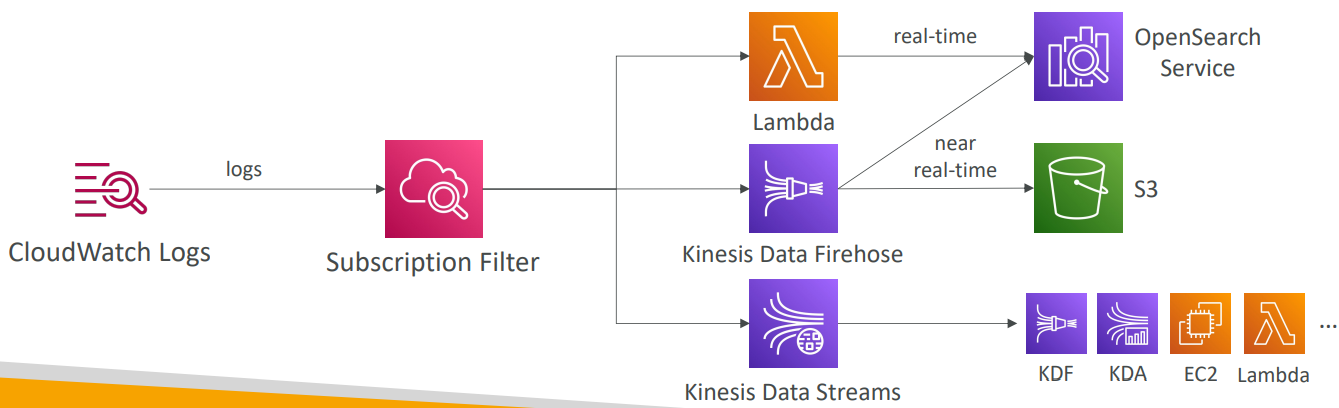
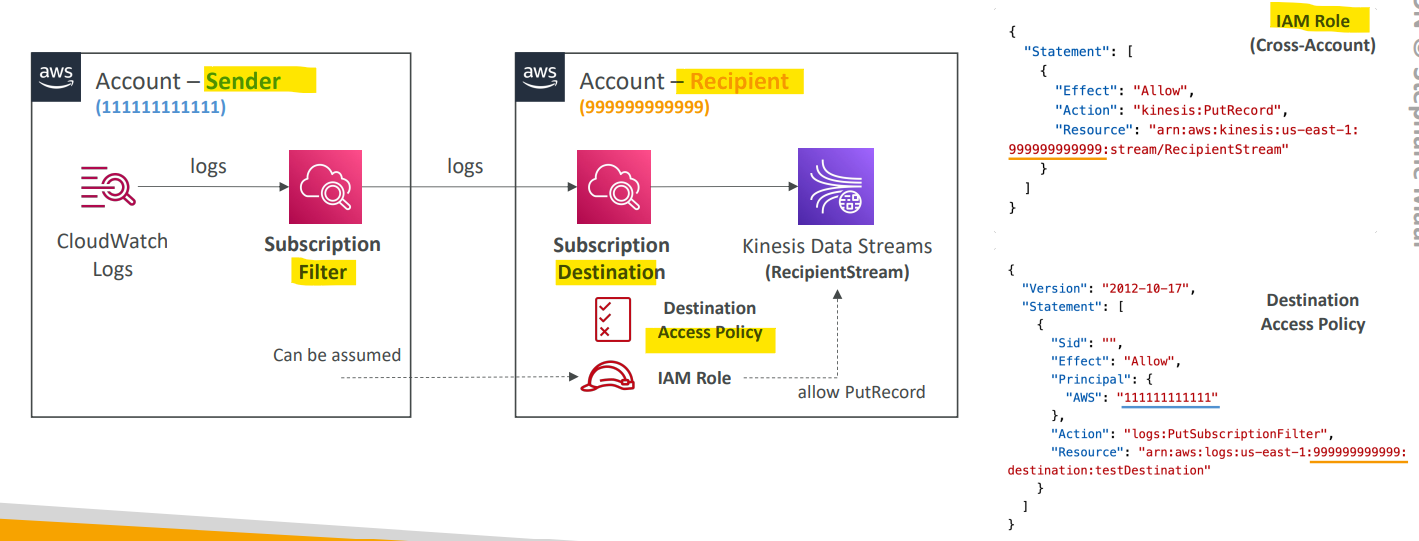
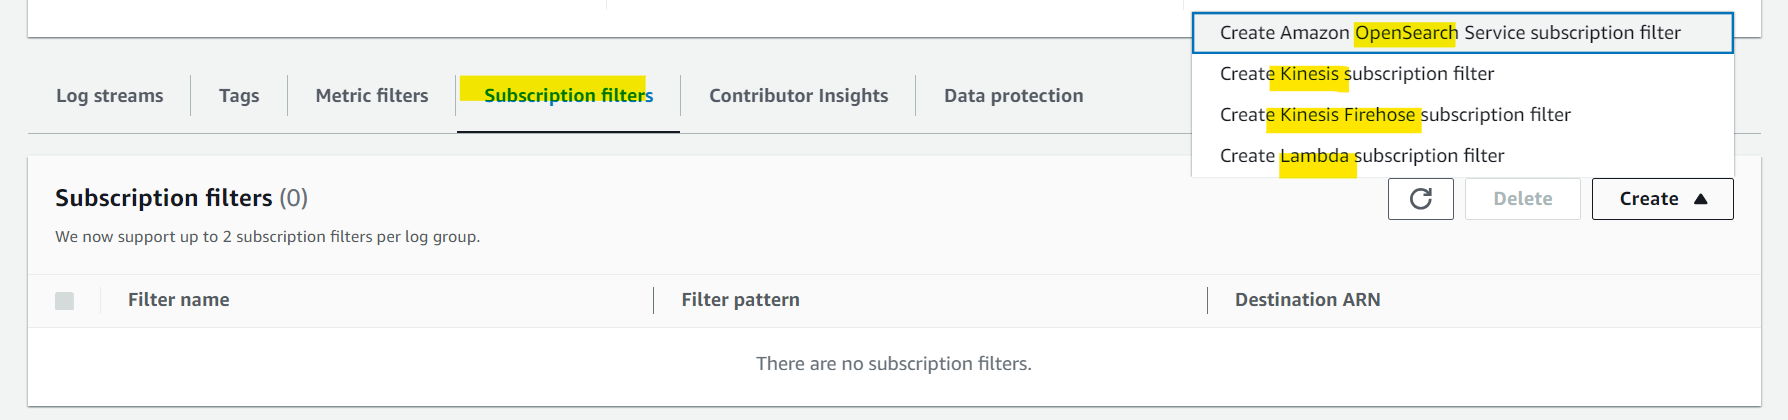
Logs Subscriptions
- Get a real-time log events from
CloudWatch Logsfor processing and analysis - Send to
Kinesis Data Streams,Kinesis Data Firehose, orLambda - Subscription Filter
- filter which logs are events delivered to your destination
Logs Aggregation
- Multi-Account & Multi Region
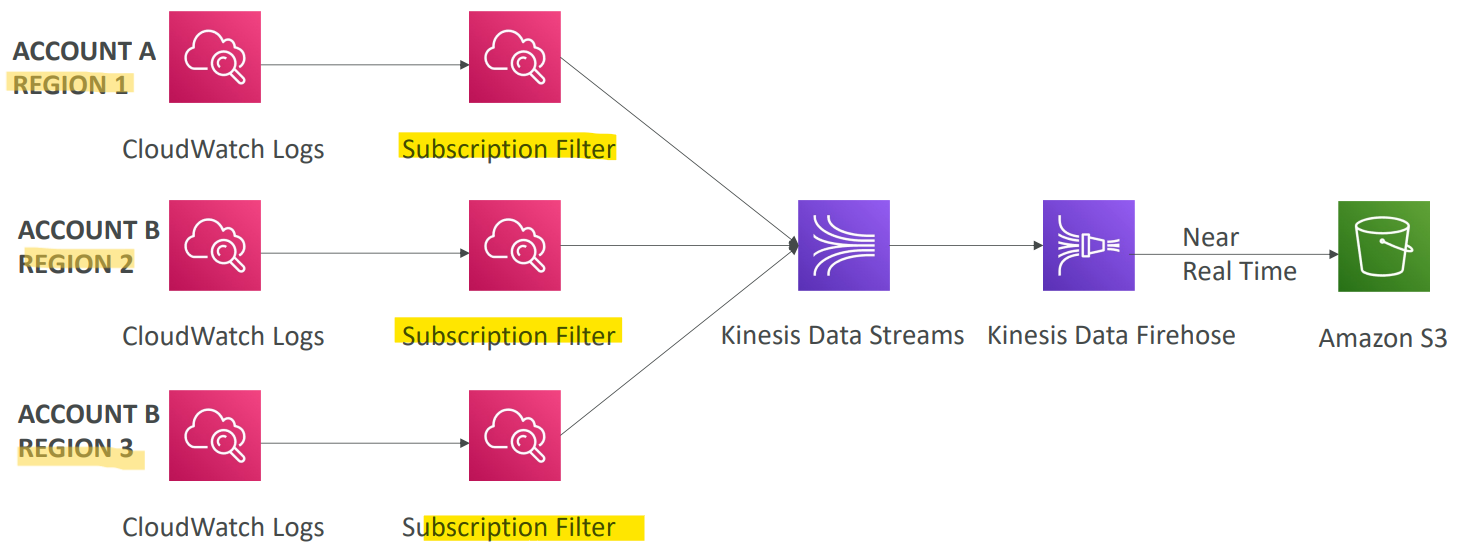
- Cross-Account Subscription
- send log events to resources in a different AWS account (KDS, KDF)
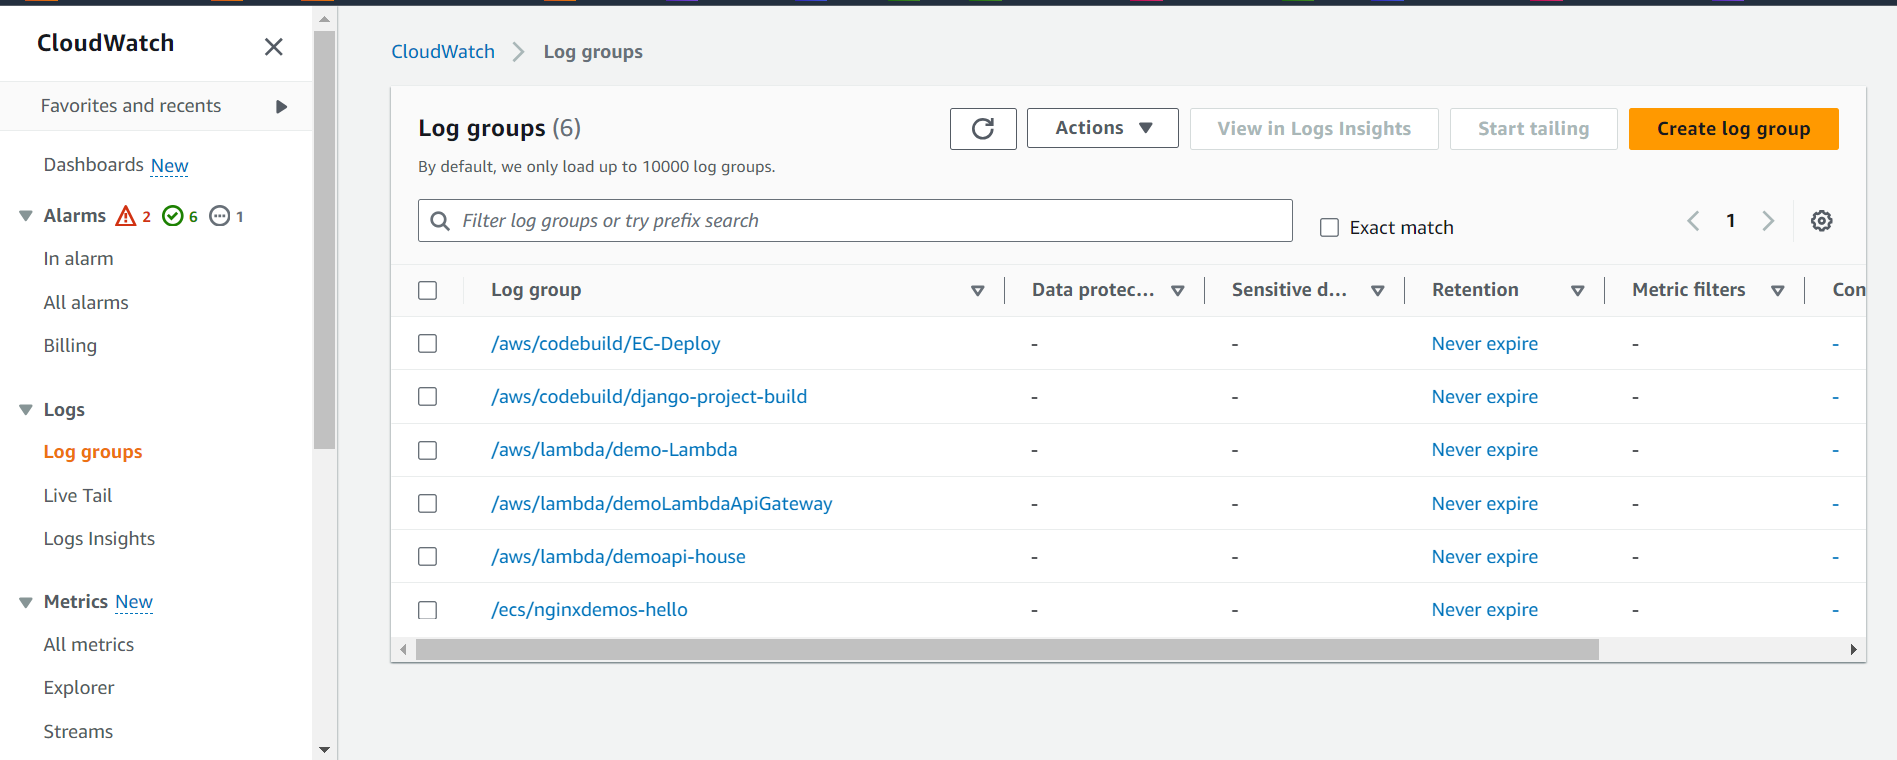
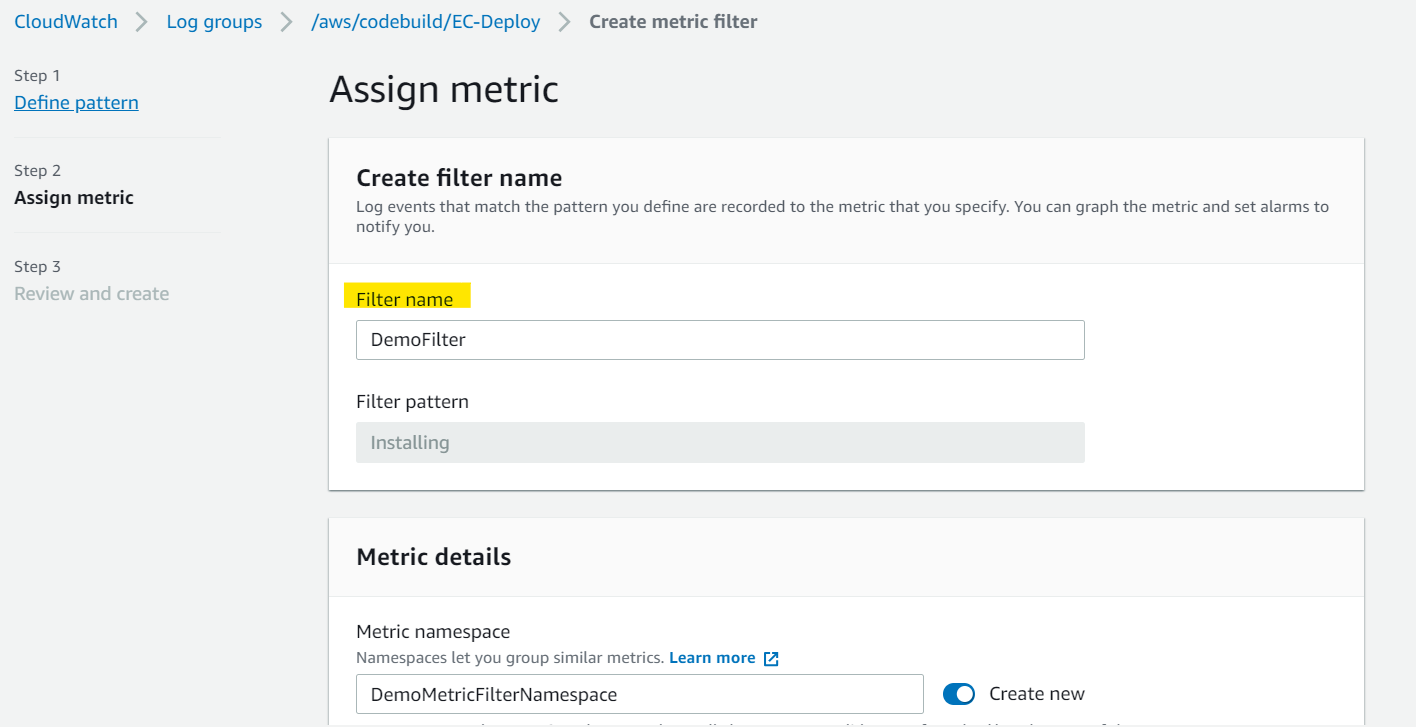
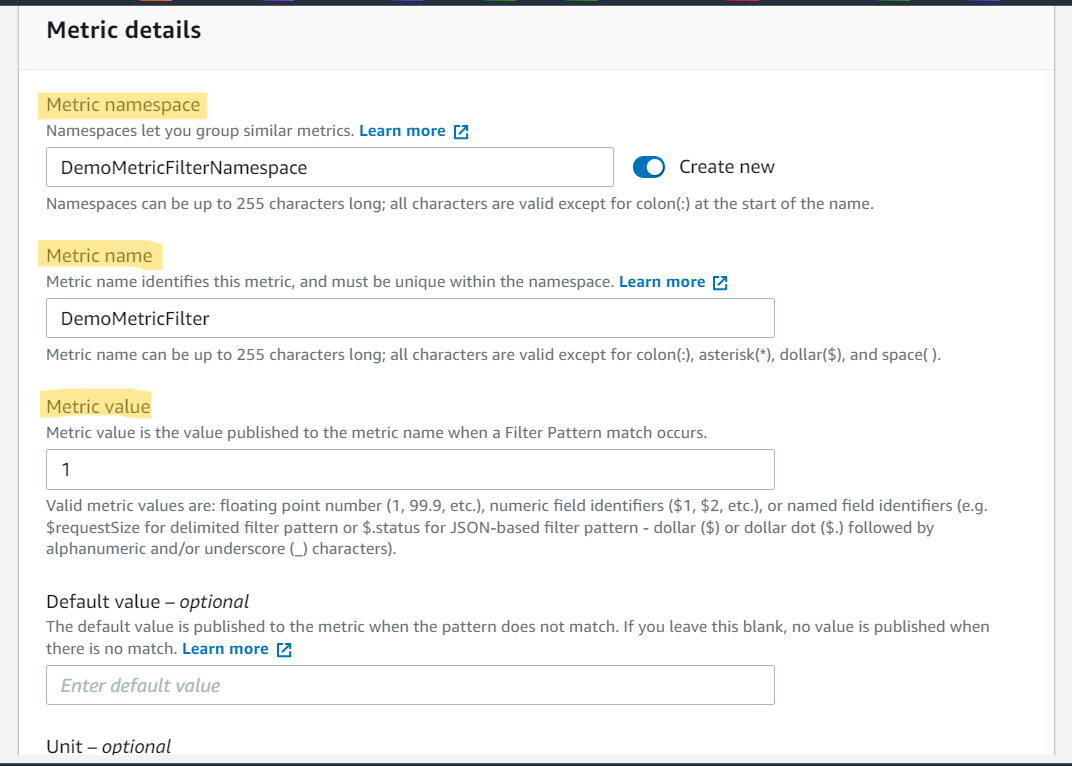
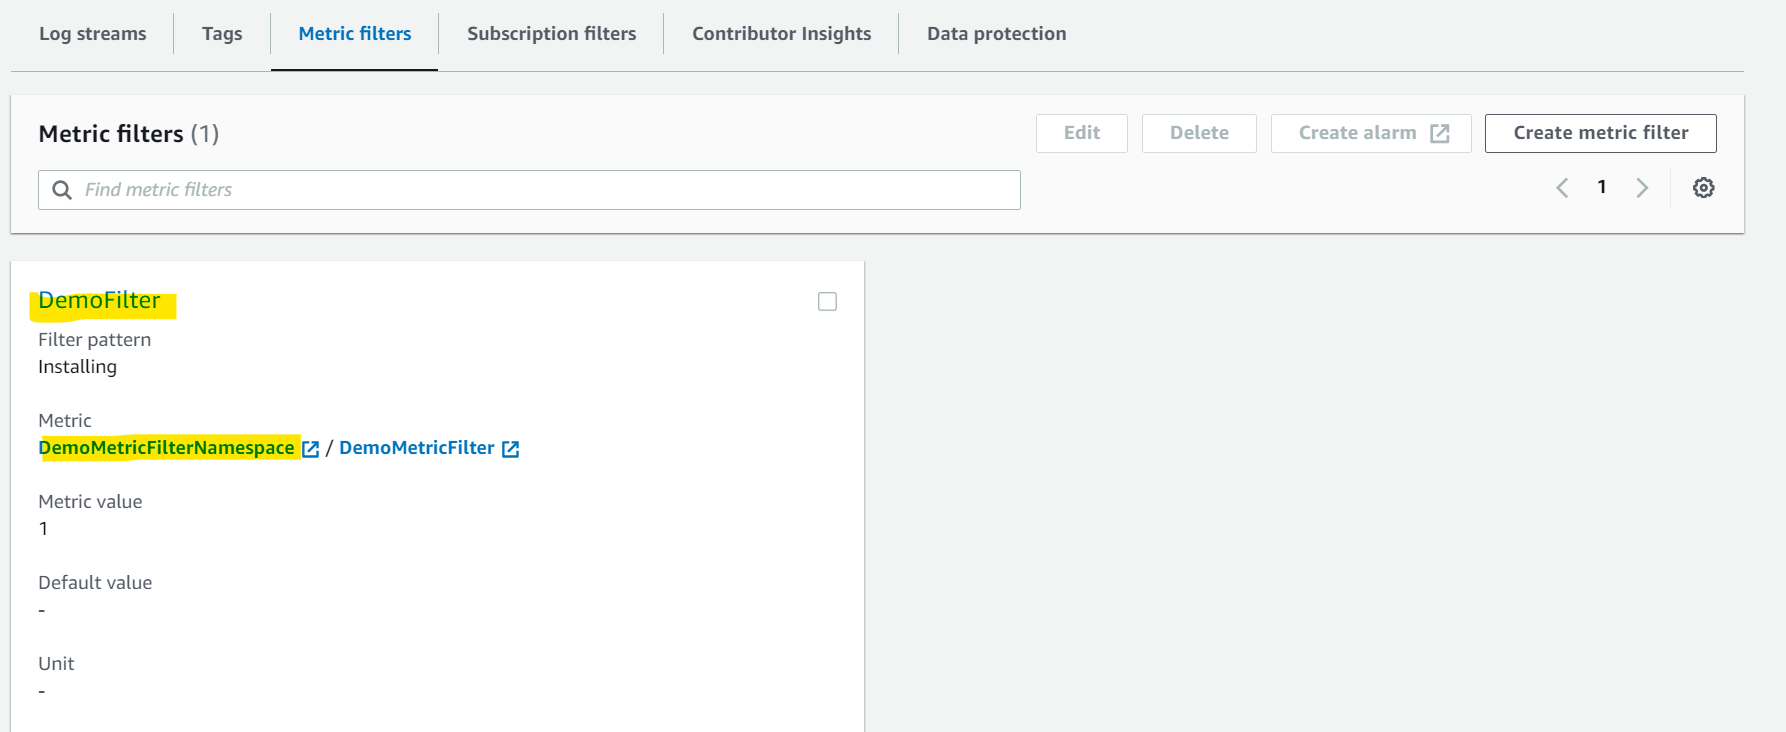
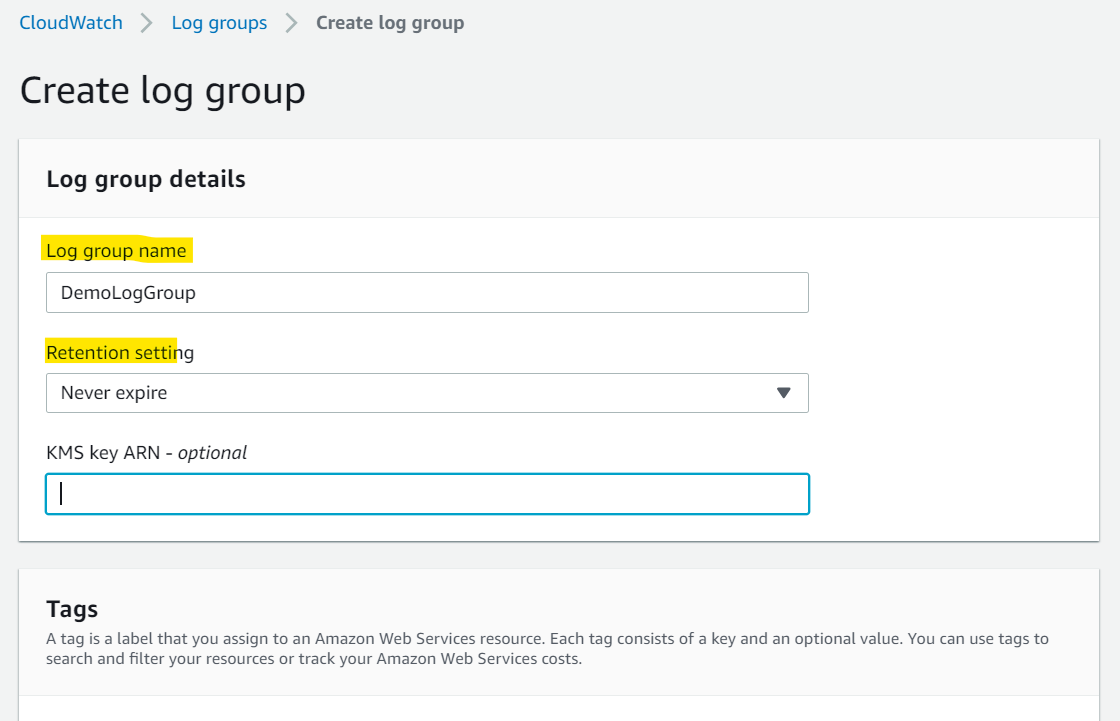
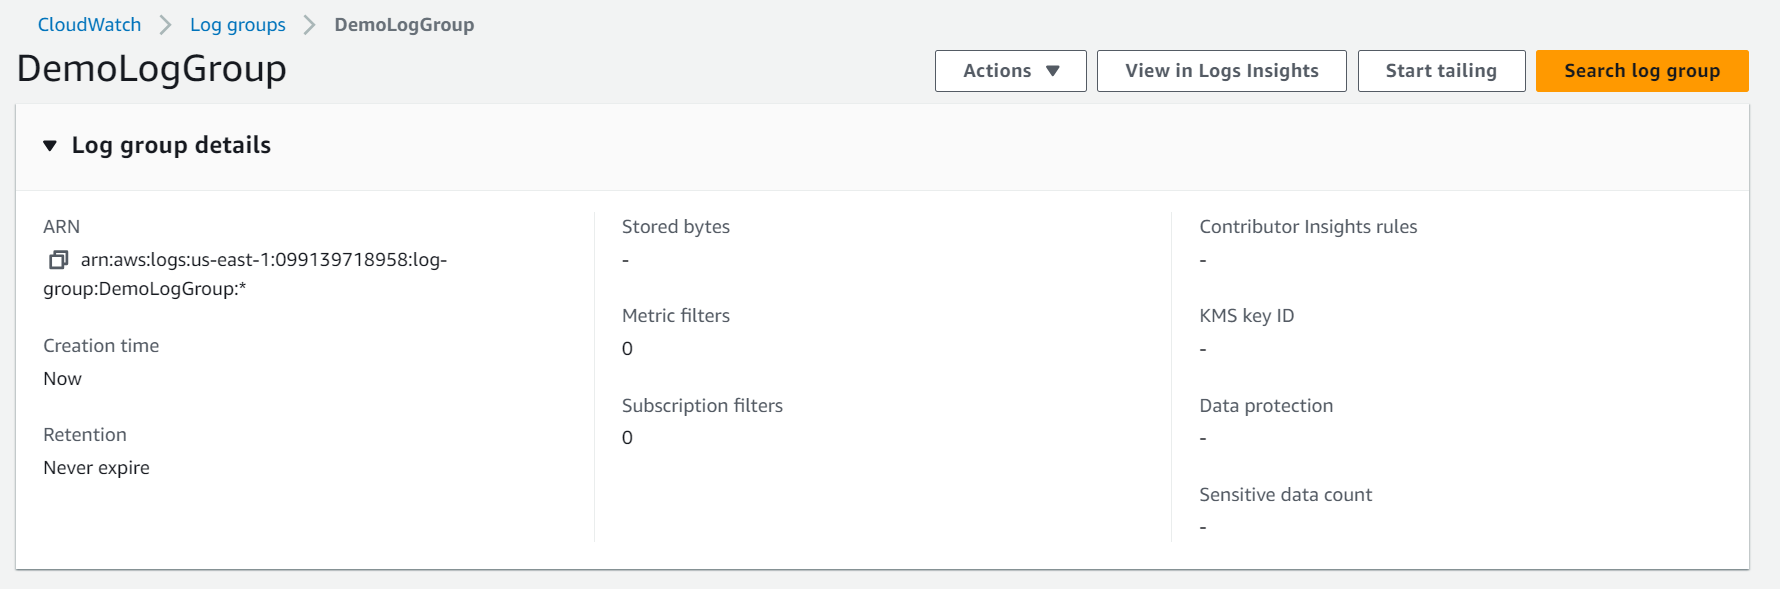
Hands-on
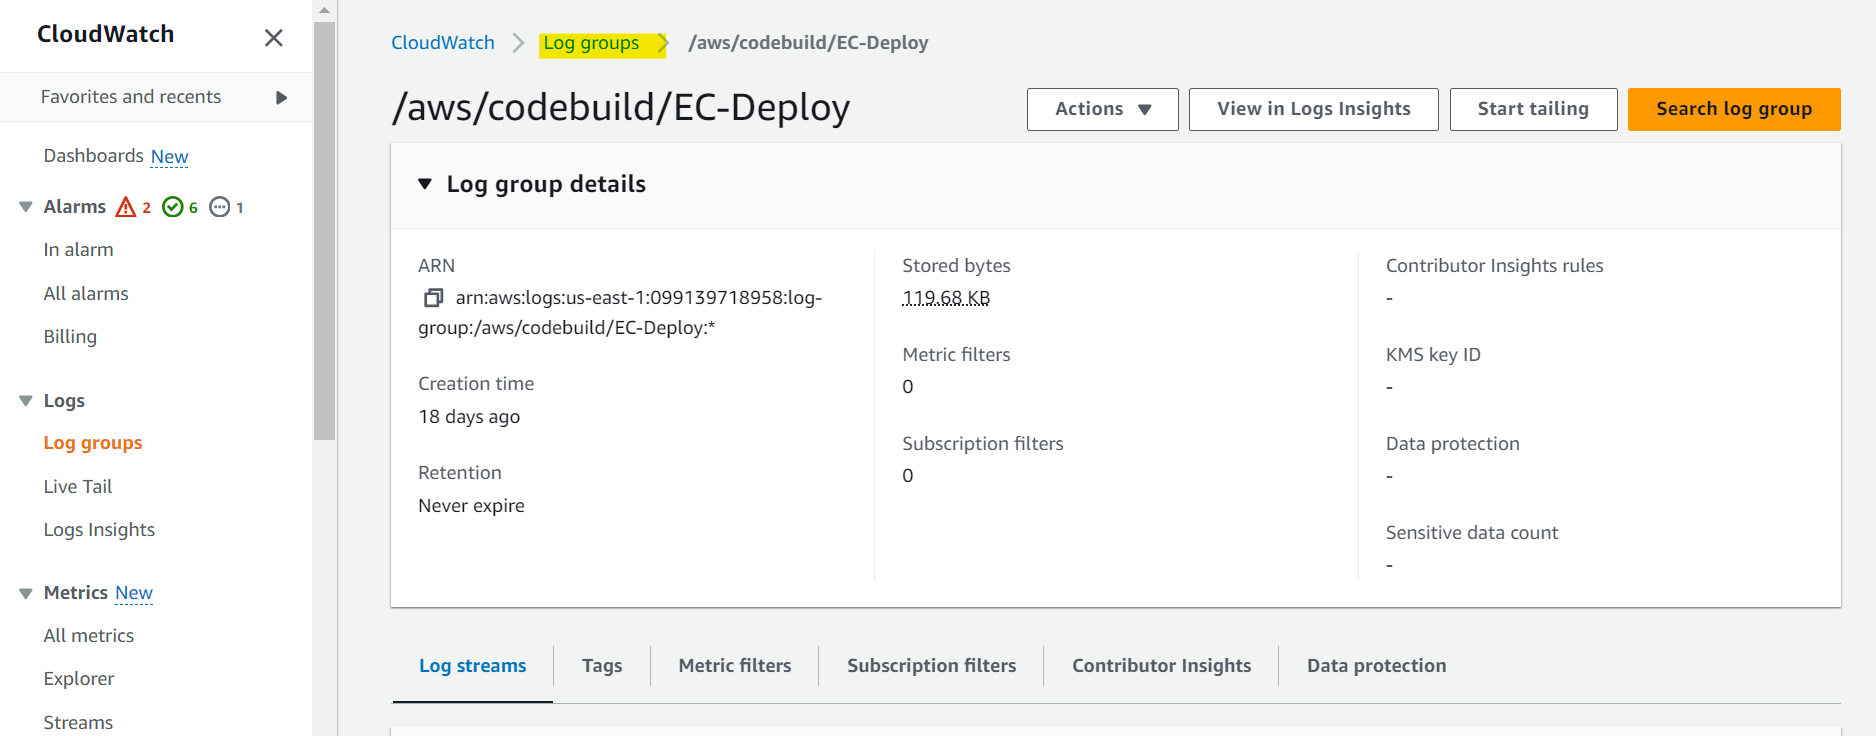
- Retension
- Log stream
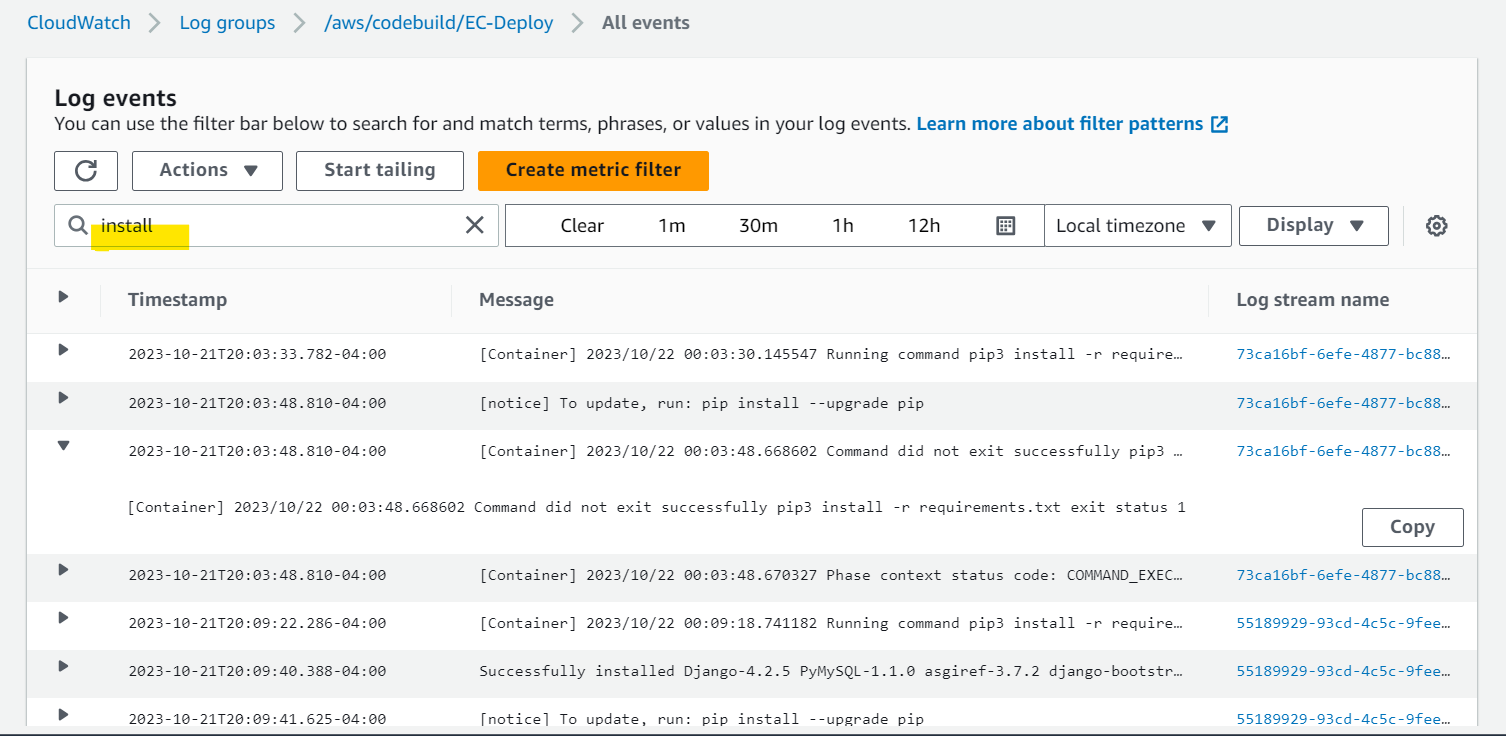
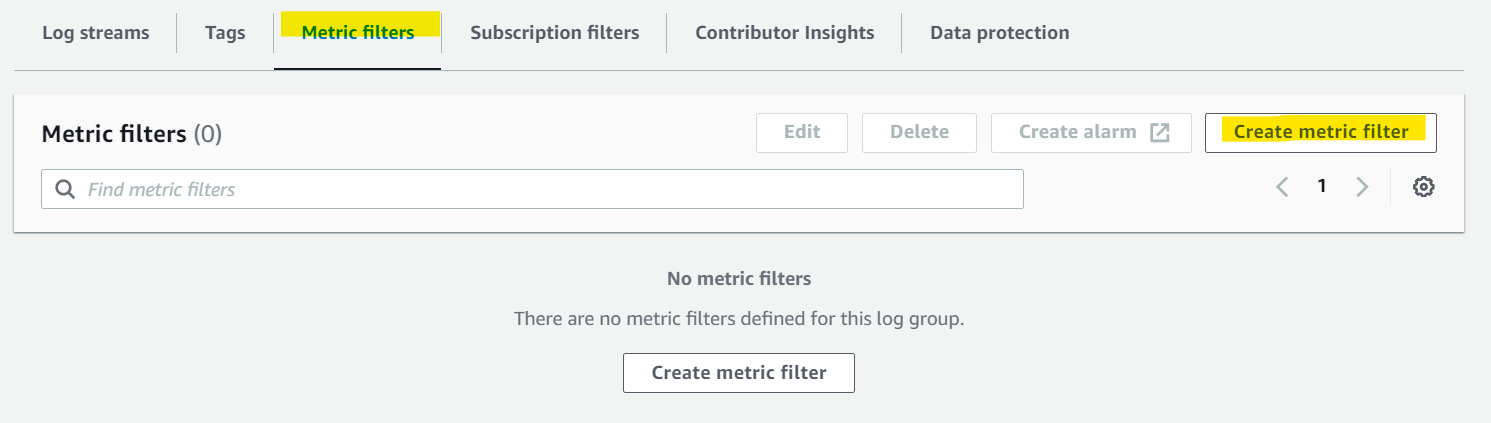
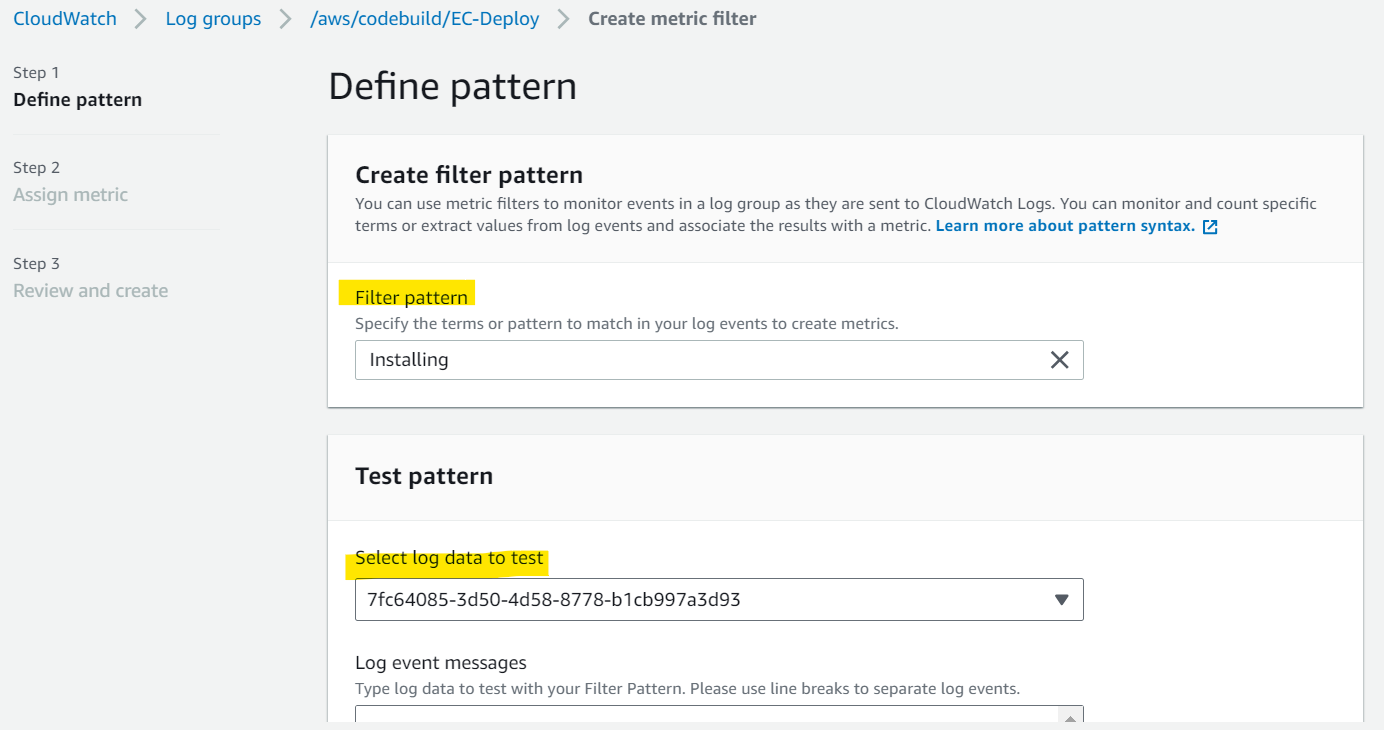
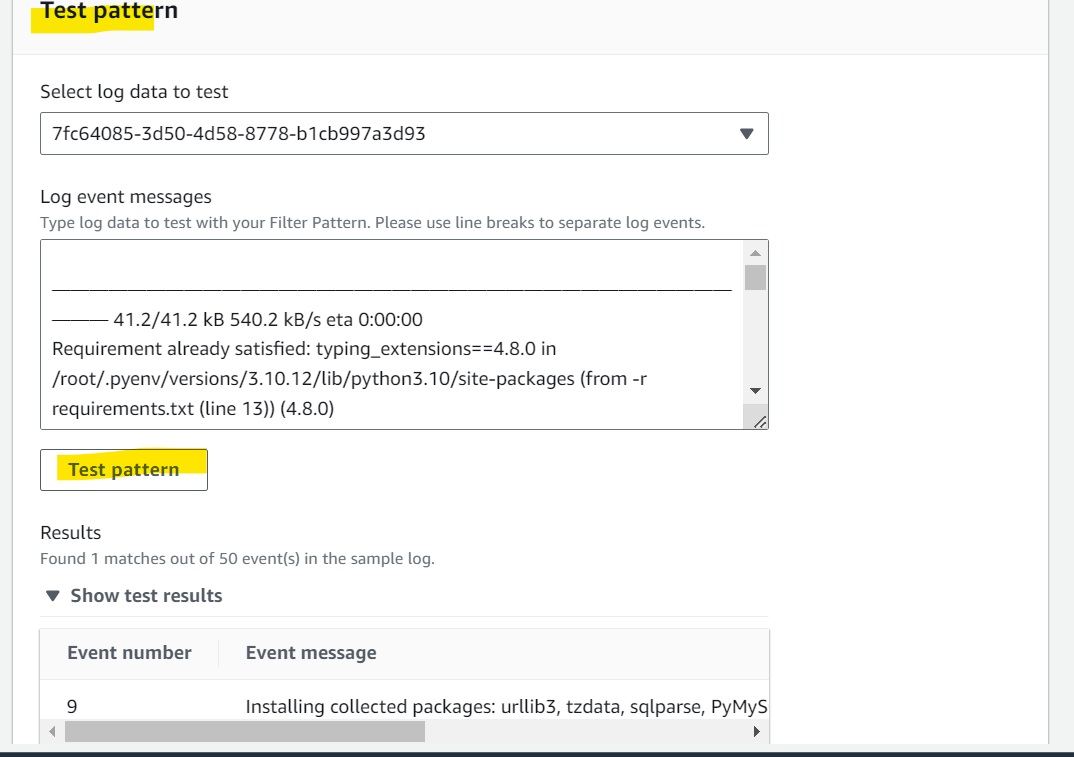
- Metric filter
- Subscription filters
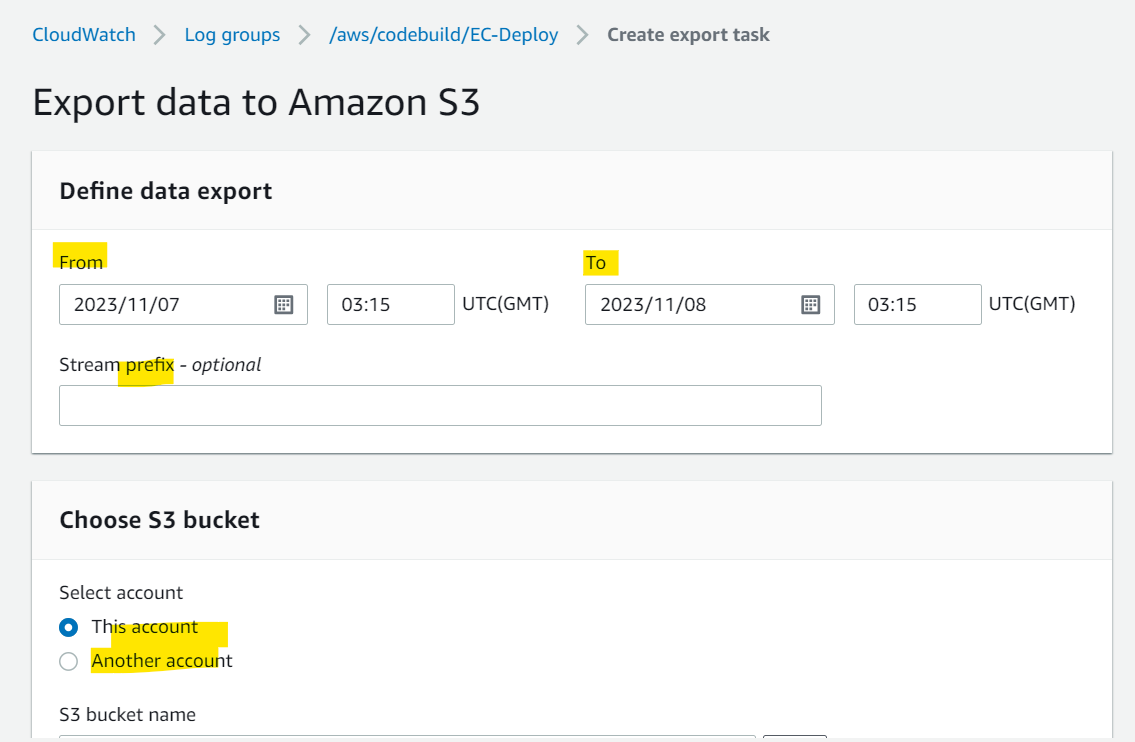
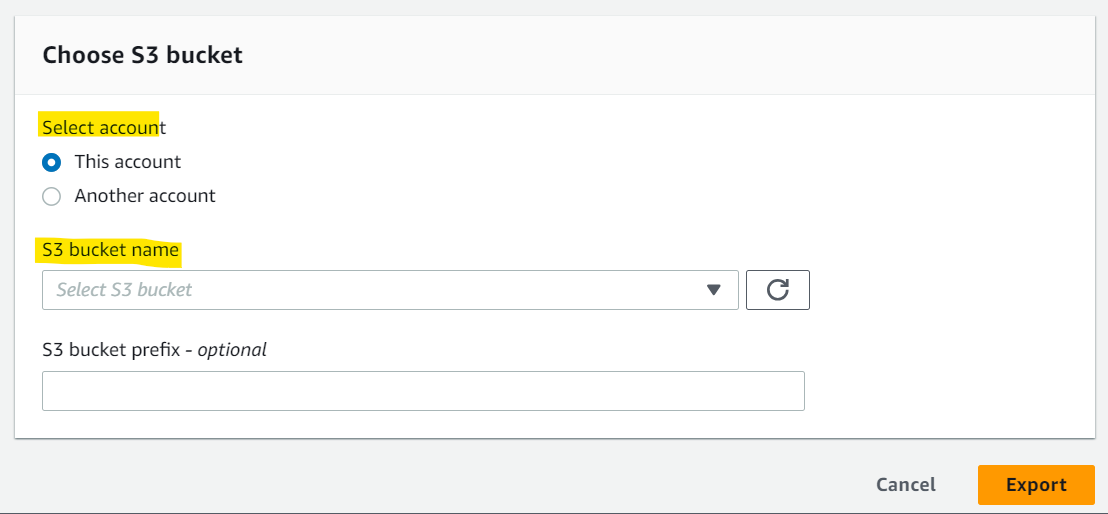
- Export Data to S3
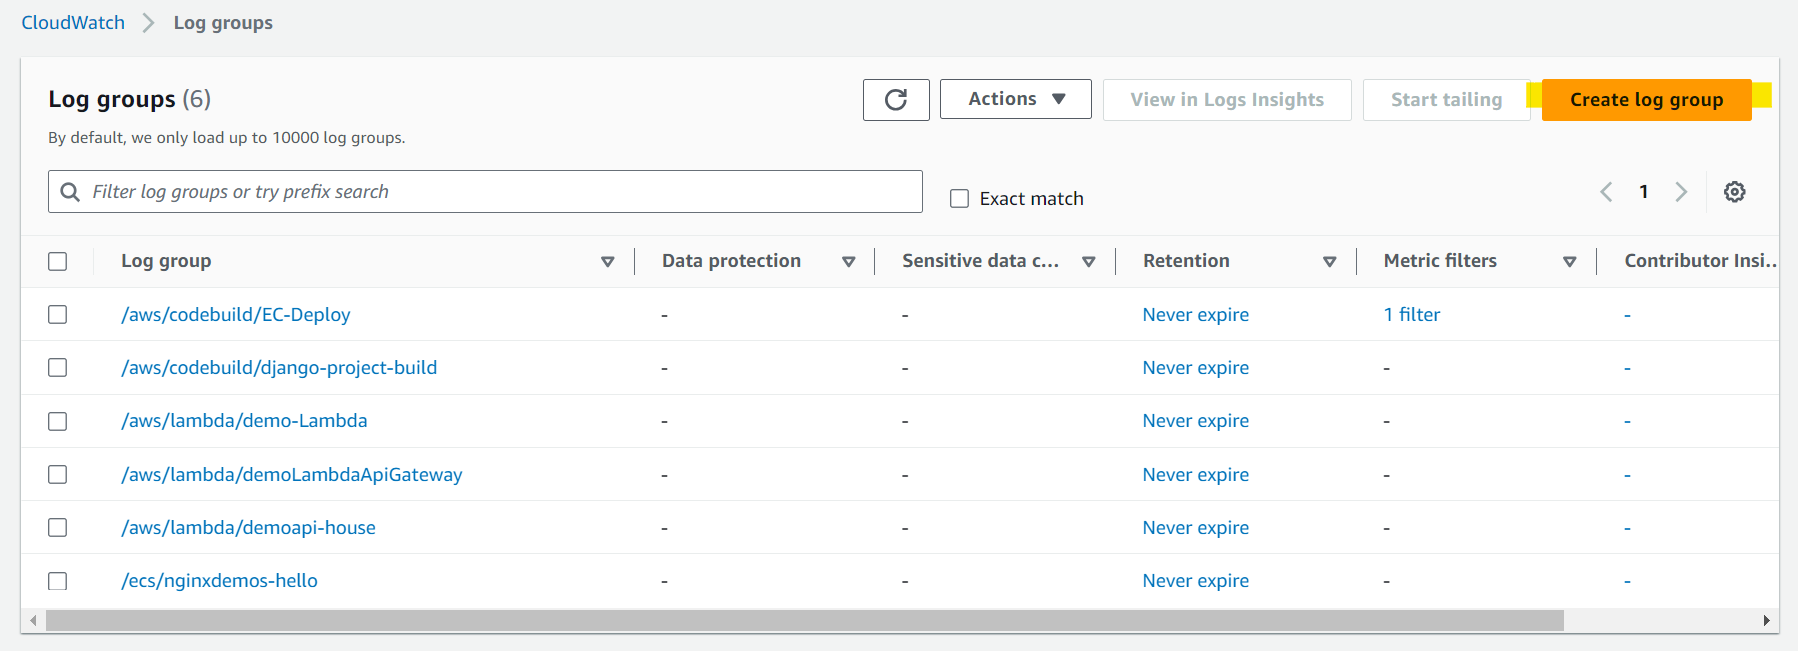
- Create Log Group
- Log Insights
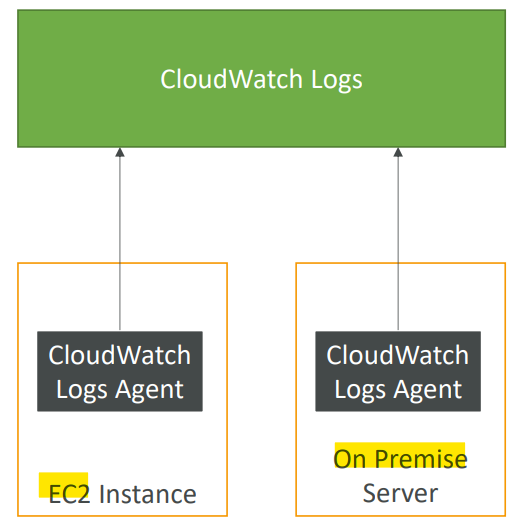
CloudWatch Agent
-
CloudWatch Agent- A small program to send log to
CloudWatch
- A small program to send log to
- By default, no logs from your
EC2machine will go toCloudWatch - You need to run a
CloudWatch agenton EC2 to push the log files you want - Make sure
IAM permissionsare correct - The
CloudWatch log agentcan be setup on-premises too
Types of CloudWatch Agent
-
Both for virtual servers (EC2 instances, on-premises servers…)
-
CloudWatch Logs Agent- Old version of the agent
- Can only send to
CloudWatch Logs
-
CloudWatch Unified Agent- Both metrics and logs
- Collect additional system-level metrics such as RAM, processes, etc…
- Collect logs to send to
CloudWatch Logs - Centralized configuration using
SSMParameter Store
-
Sample:
- How would you monitor your EC2 instance memory usage in CloudWatch?
- Unifited CW Agent + CW custom metric
CloudWatch Unified Agent – Metrics
-
Unified Agent- out-of-the box metrics for EC2 – disk, CPU, network (high level)
- Collected directly on your
Linuxserver /EC2instance
-
Metrics
- CPU
- active, guest, idle, system, user, steal
- Disk metrics
- free, used, total,
- Disk IO
- writes, reads, bytes, iops
- RAM
- free, inactive, used, total, cached
- Netstat
- number of TCP and UDP connections, net packets, bytes
- Processes
- total, dead, bloqued, idle, running, sleep
- Swap Space
- free, used, used %
- CPU
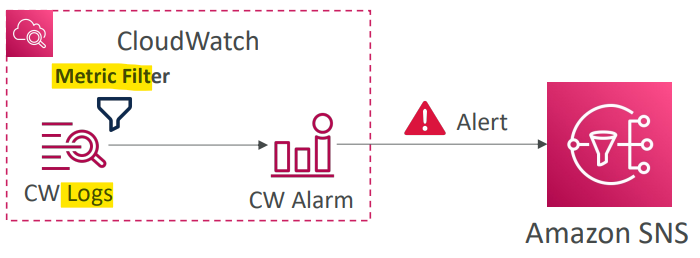
CloudWatch - Alarms
-
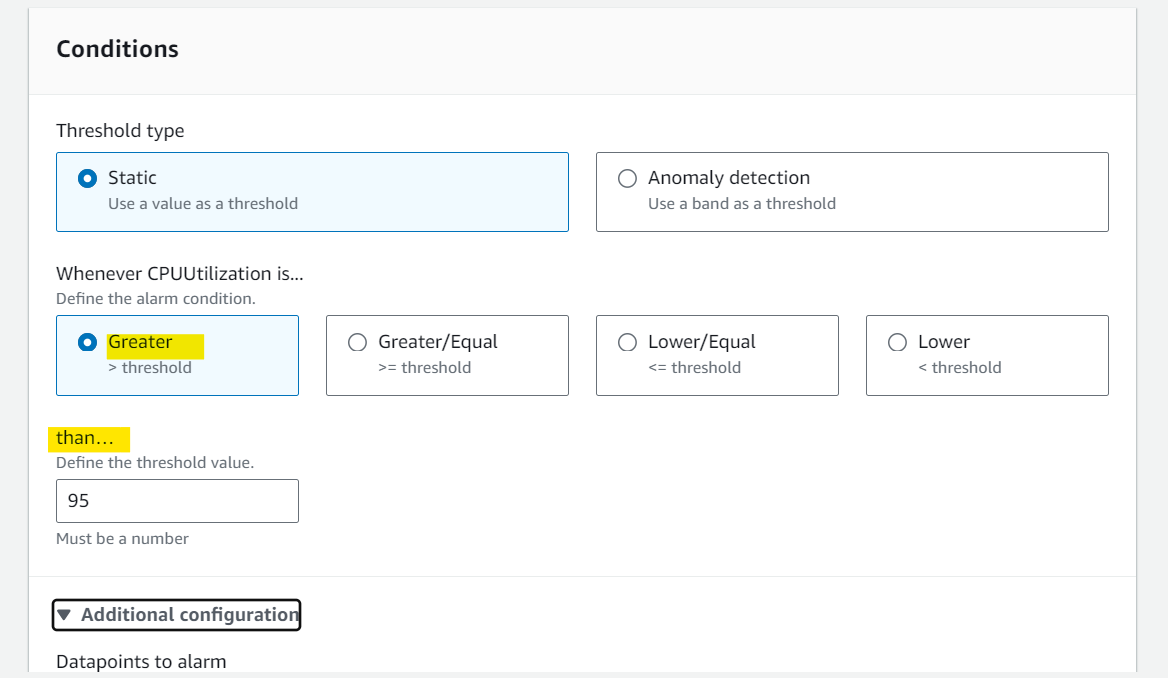
Alarms- used to trigger notifications for any metric
- Various options (sampling, %, max, min, etc…)
-
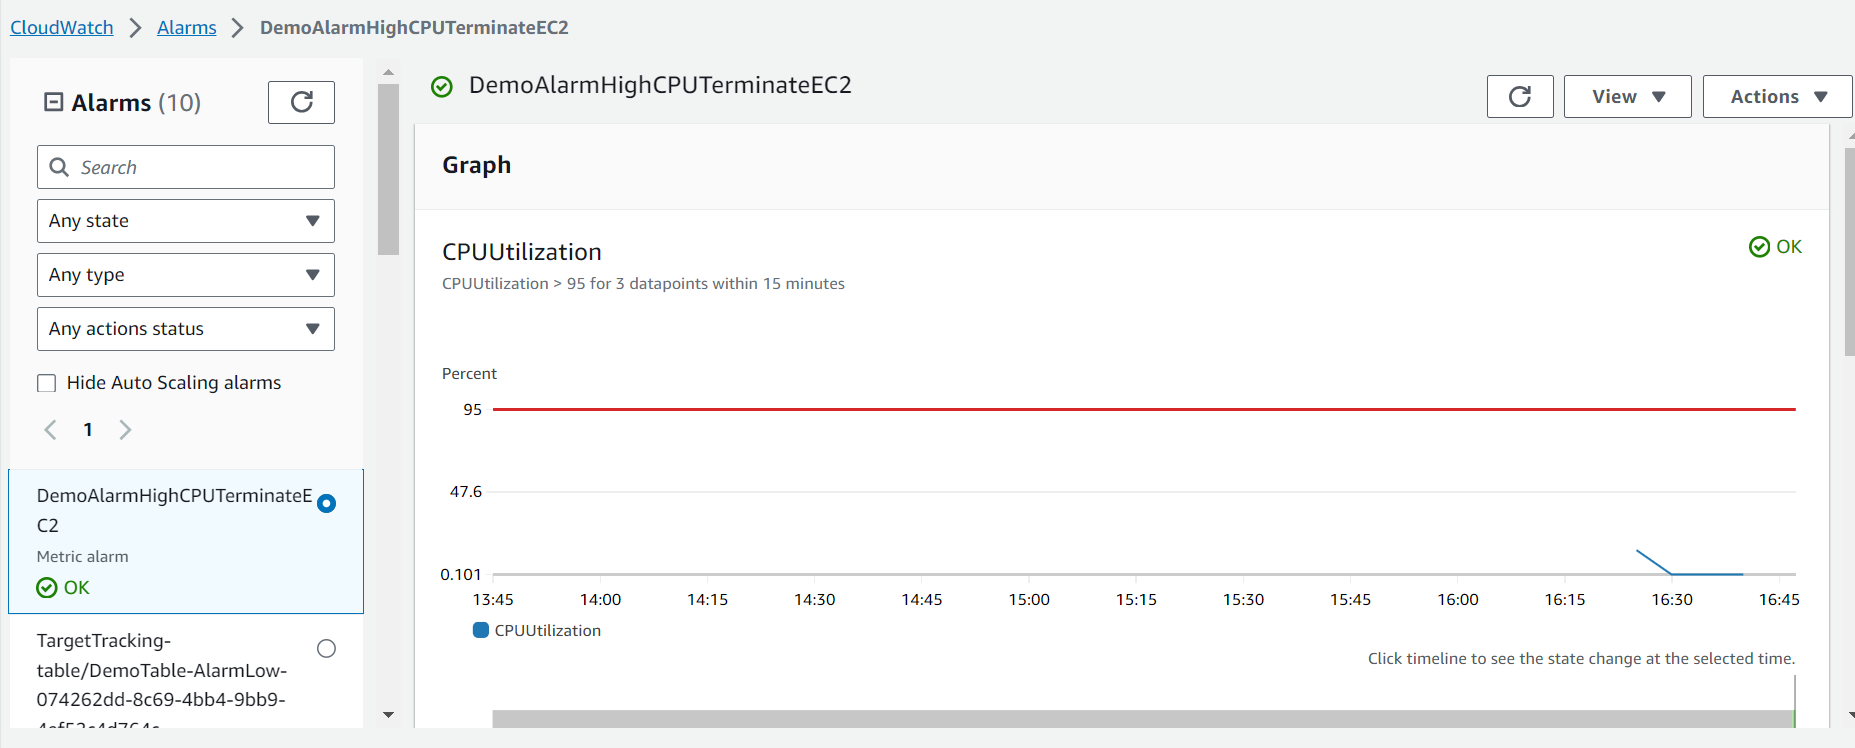
Alarm States:
OK: not triggeredINSUFFICIENT_DATA: not enough data to determine a stateALARM: the threhold has been breached and a notification will be sent.
-
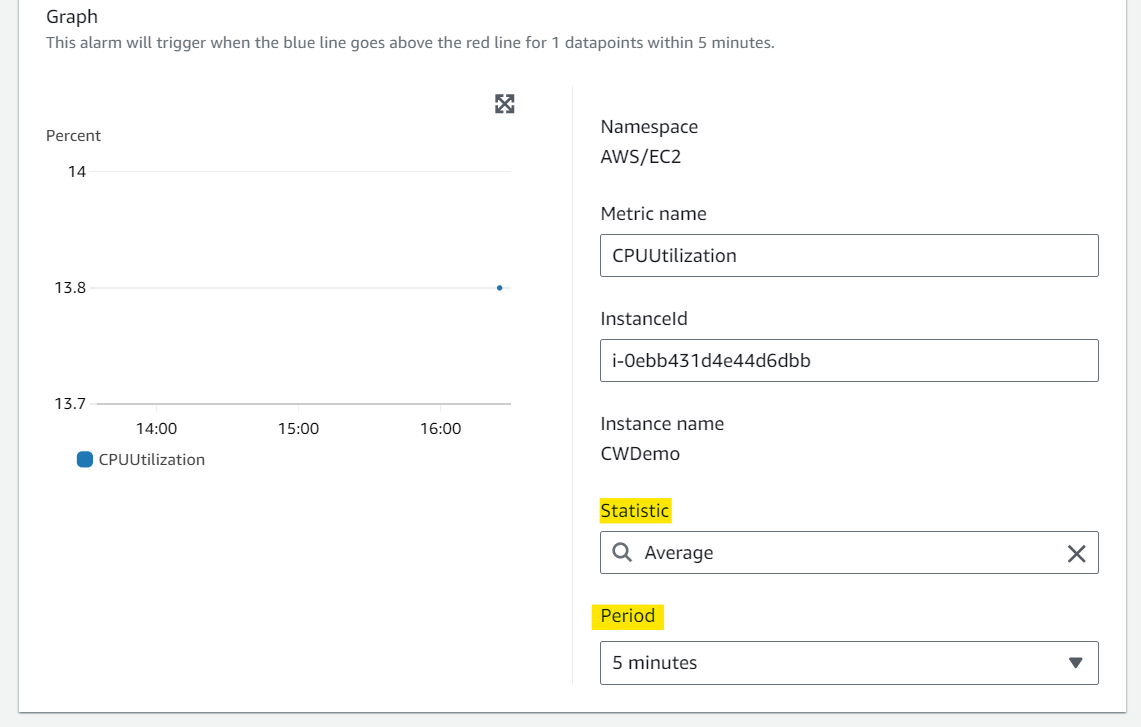
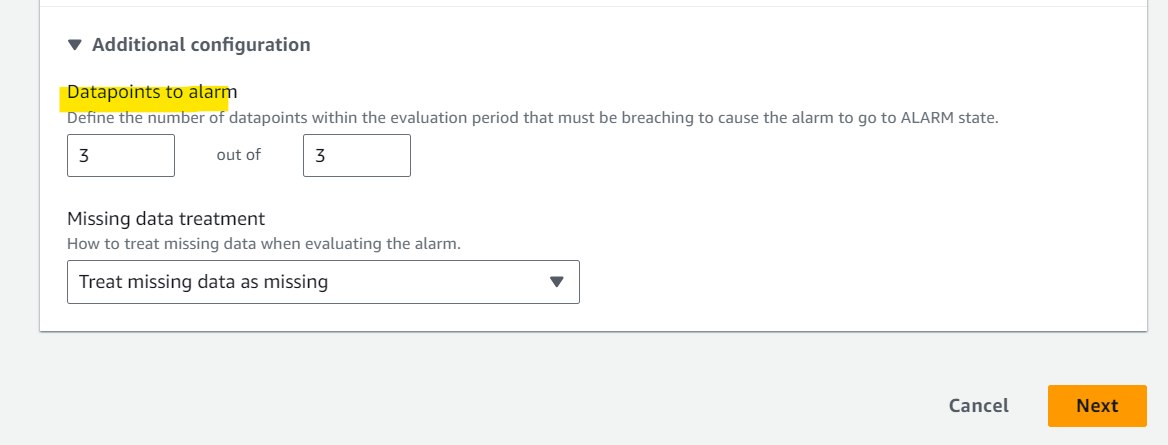
Period:
- Length of time in seconds to evaluate the metric
- High resolution custom metrics:
- 10 sec, 30 sec or multiples of 60 sec
-
Integration:
Alarmscan be created based onCloudWatch Logs Metrics Filters
-
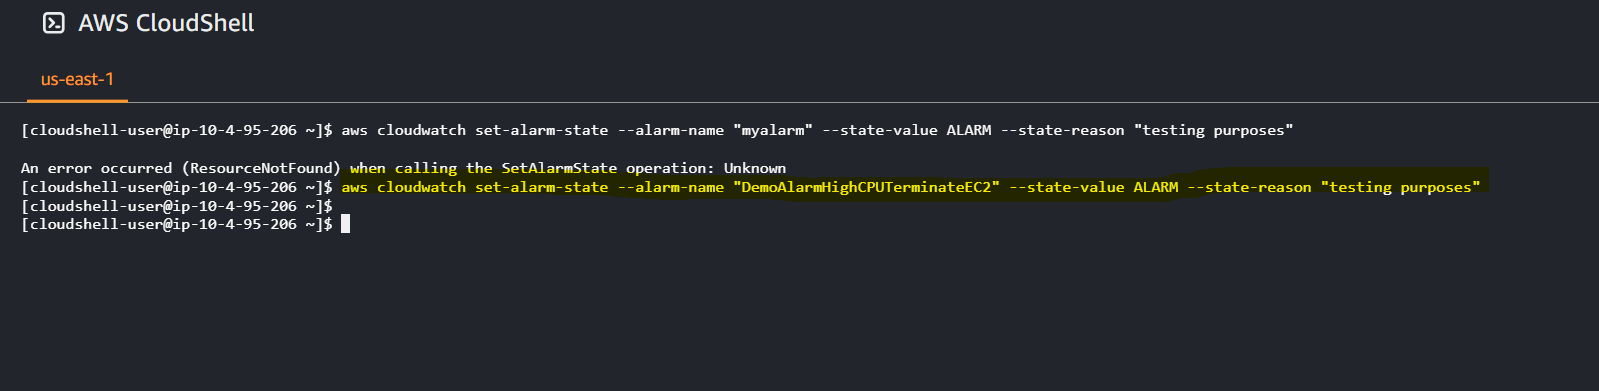
Test
- To test alarms and notifications, set the alarm state to
AlarmusingCLI
- To test alarms and notifications, set the alarm state to
aws cloudwatch set-alarm-state --alarm-name "myalarm" --state-value ALARM --state-reason "testing purposes"
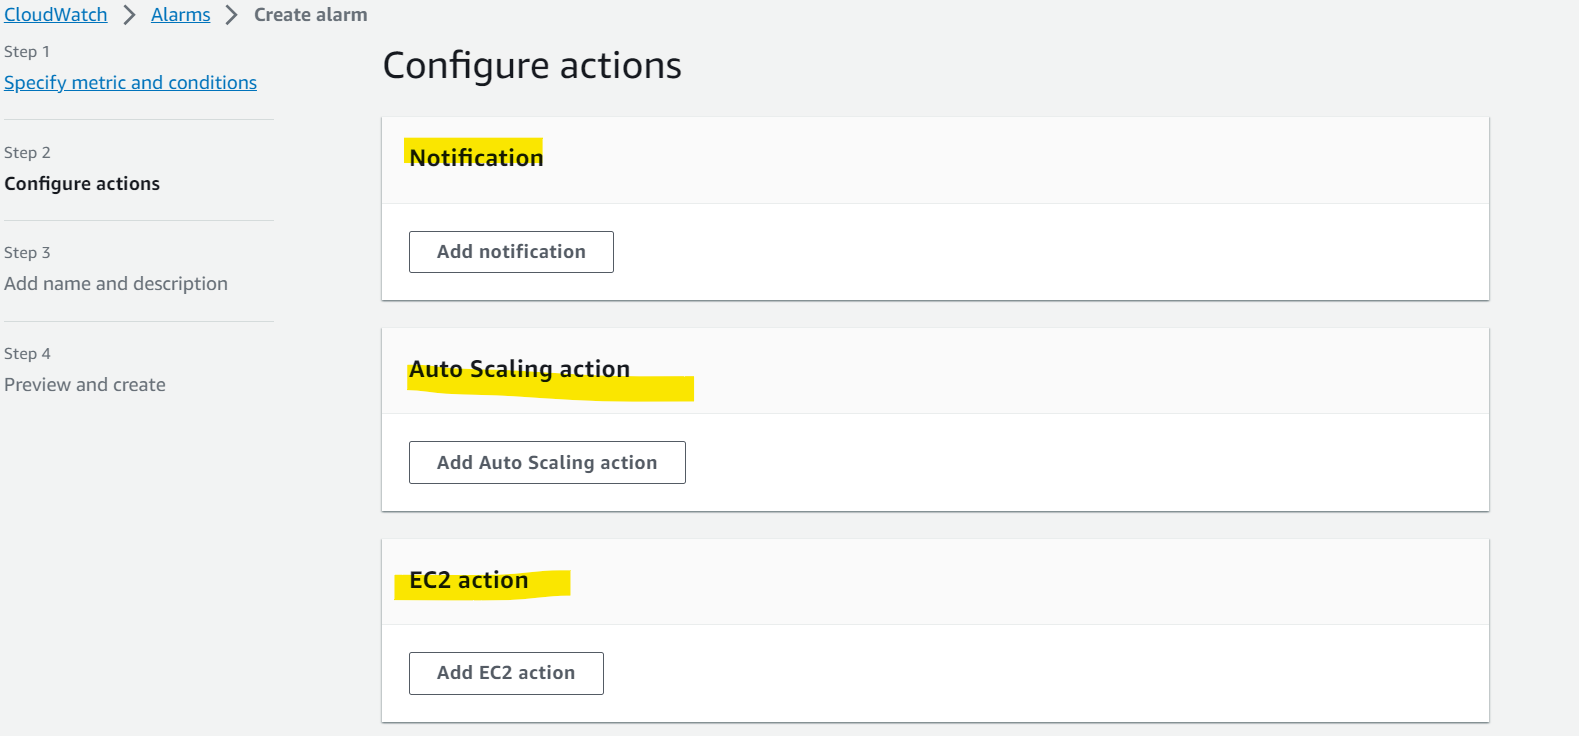
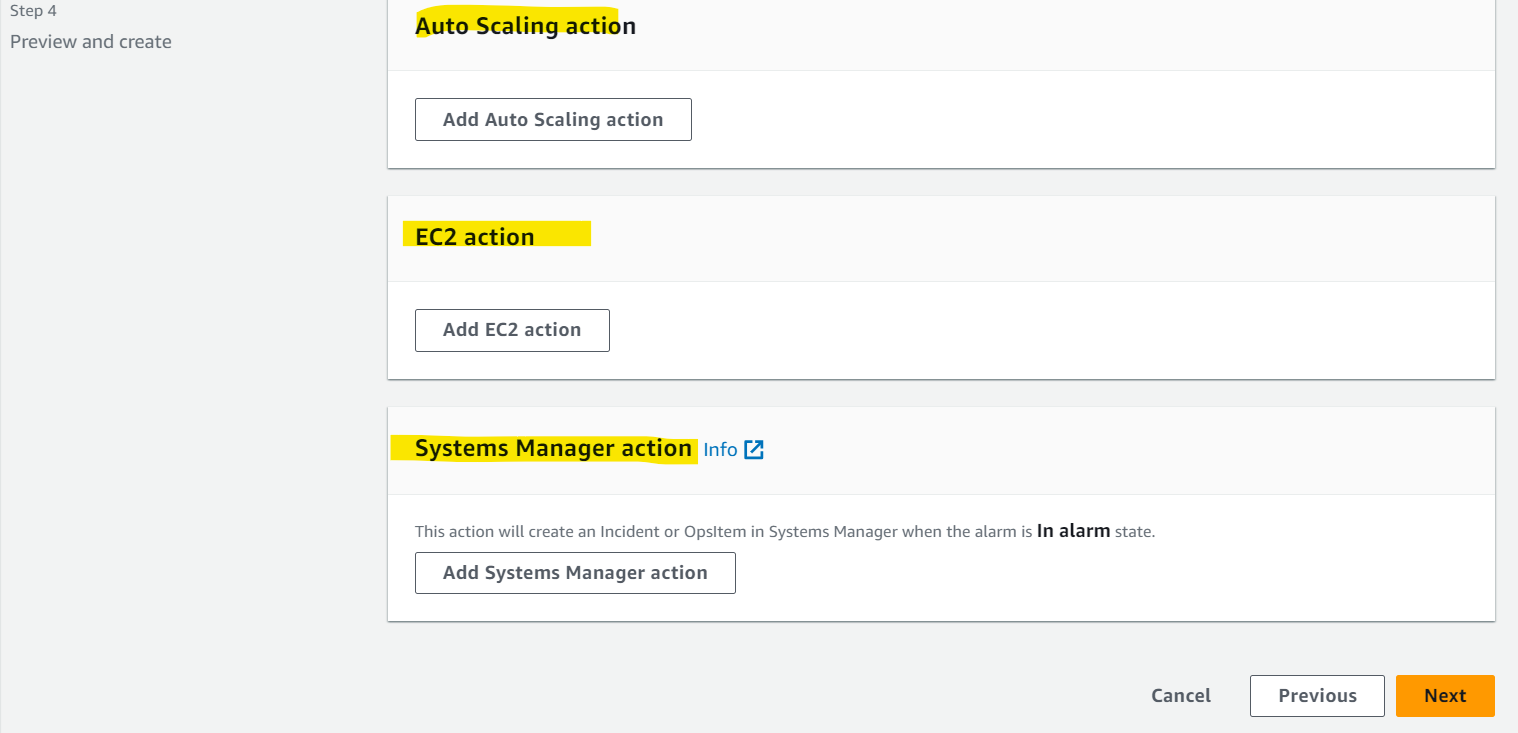
Alarm Targets
-
3 types of Alarm target
- Amazon
EC2- trigger to Stop, Terminate, Reboot, or Recover an EC2 Instance
EC2 Auto Scaling- Trigger Auto Scaling Action, scall out or in.
- Amazon
SNS- Send notification to
SNS(from which you can do pretty much anything)
- Send notification to
- Amazon
-
Sample:
- You have an application hosted on a fleet of EC2 instances managed by an Auto Scaling Group that you configured its minimum capacity to 2. Also, you have created a CloudWatch Alarm that is configured to scale in your ASG when CPU Utilization is below 60%. Currently, your application runs on 2 EC2 instances and has low traffic and the CloudWatch Alarm is in the ALARM state. What will happen?
- The number of EC2 instances in an ASG can not go below the minimum capacity, even if the CloudWatch alarm would in theory trigger an EC2 instance termination.
- You have an application hosted on a fleet of EC2 instances managed by an Auto Scaling Group that you configured its minimum capacity to 2. Also, you have created a CloudWatch Alarm that is configured to scale in your ASG when CPU Utilization is below 60%. Currently, your application runs on 2 EC2 instances and has low traffic and the CloudWatch Alarm is in the ALARM state. What will happen?
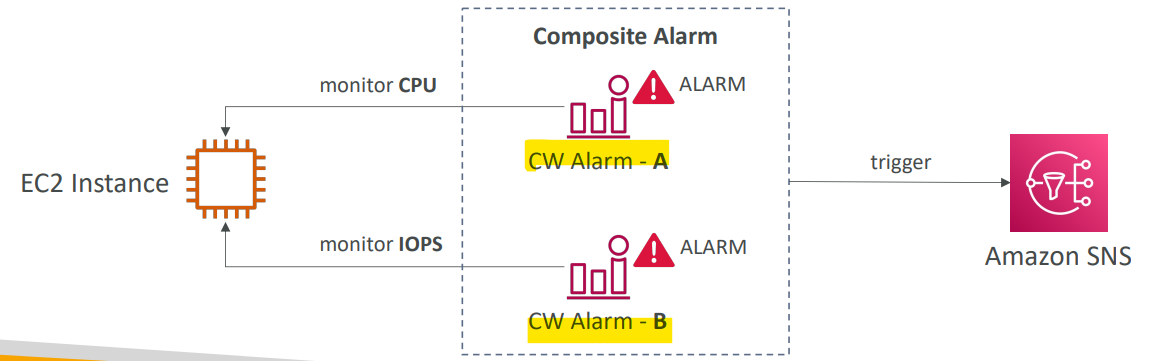
Composite Alarms
Composite Alarms- monitor the states of multiple other alarms
CloudWatch Alarmsare on a single metric
ANDandORconditions
- monitor the states of multiple other alarms
- Helpful to reduce “alarm noise” by creating complex composite alarms
Use Case: EC2 Instance Recovery
-
Status Check:
- Instance status = check the EC2 VM
- System status = check the underlying hardware
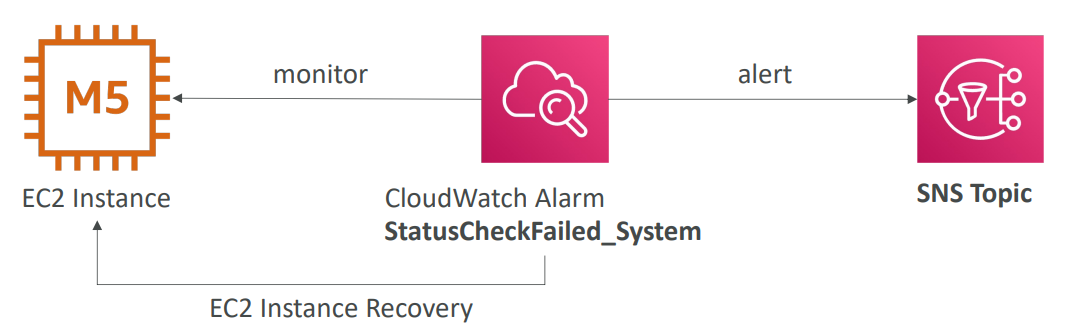
- When Recovery:
- Same Private, Public, Elastic IP, metadata, placement group
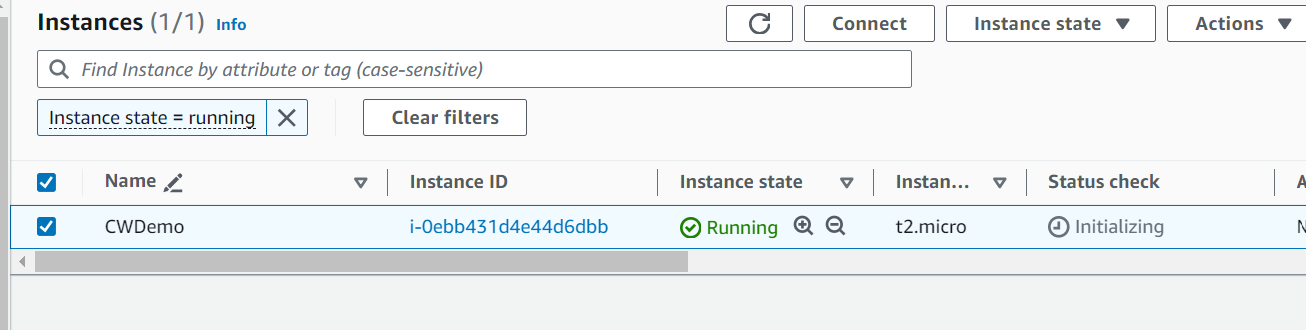
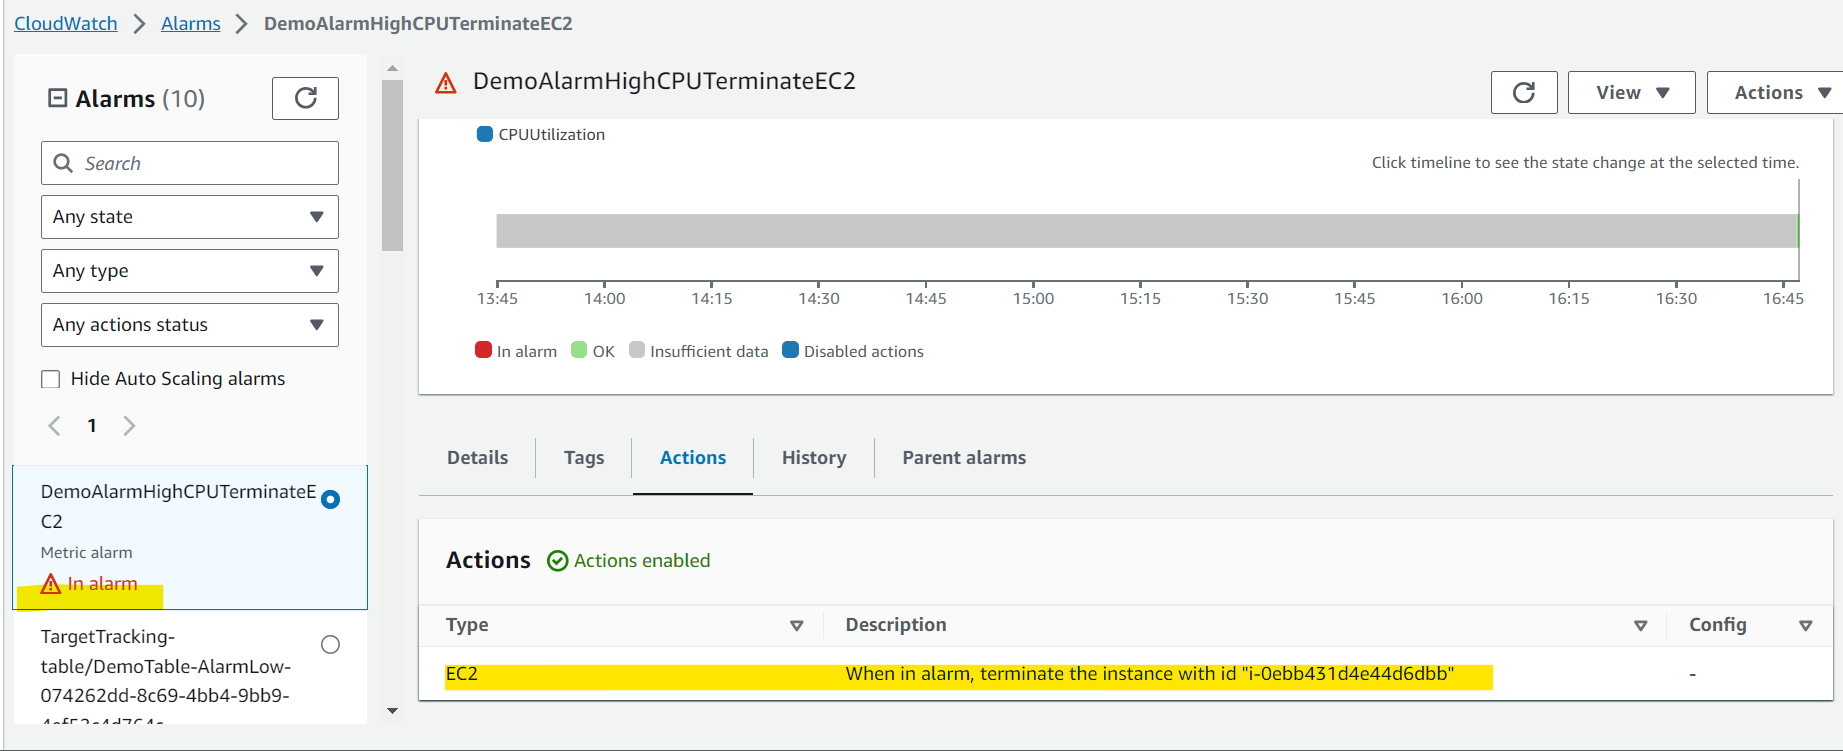
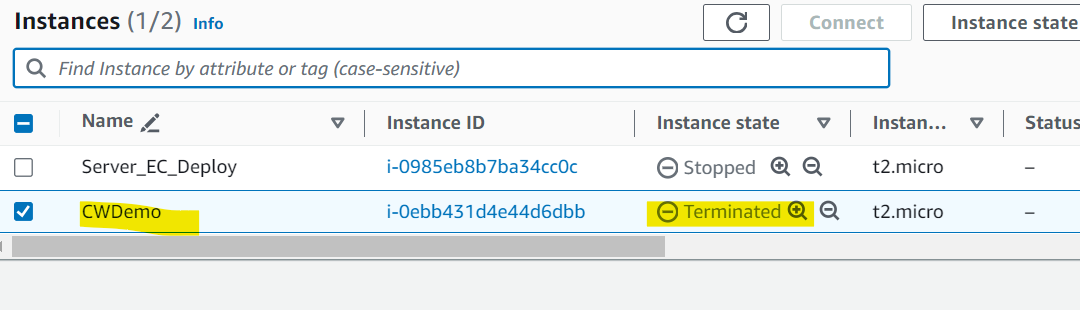
Hands-on
- Create EC2 instance
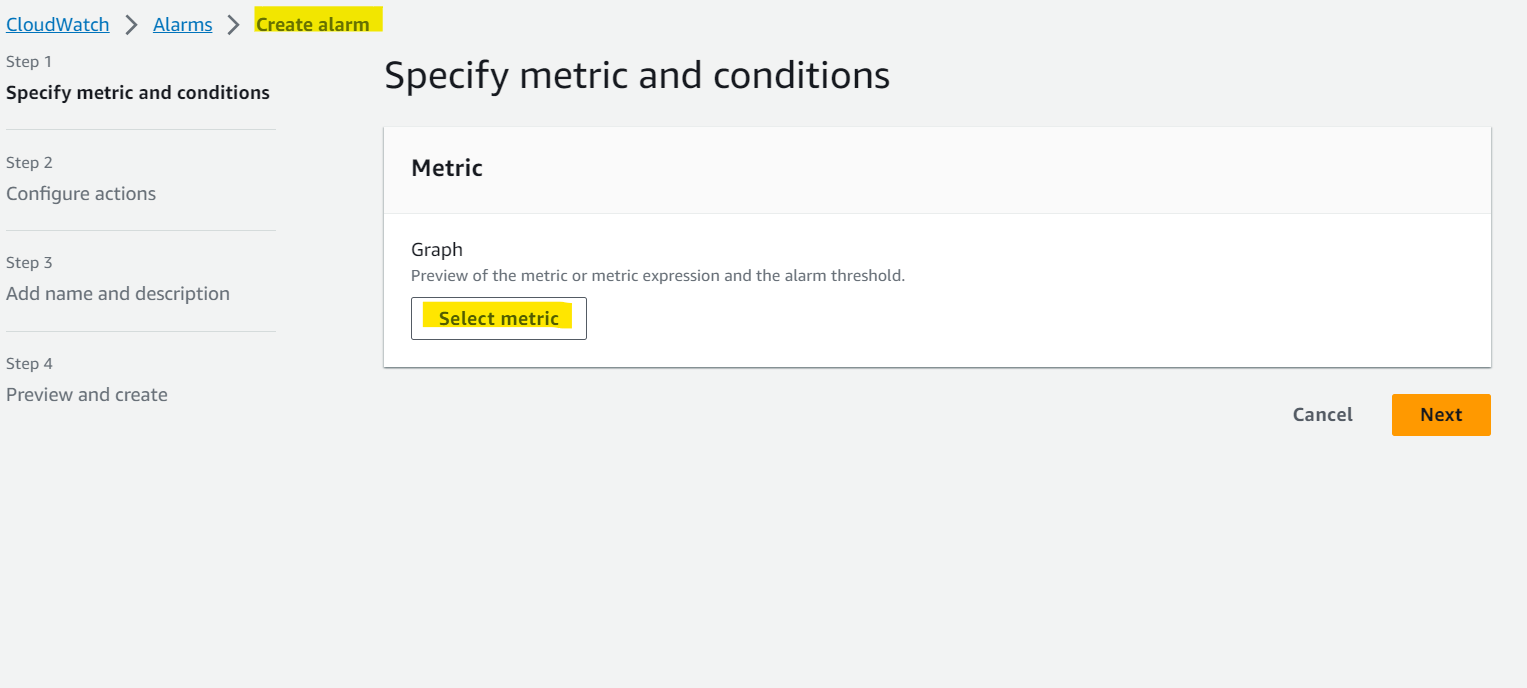
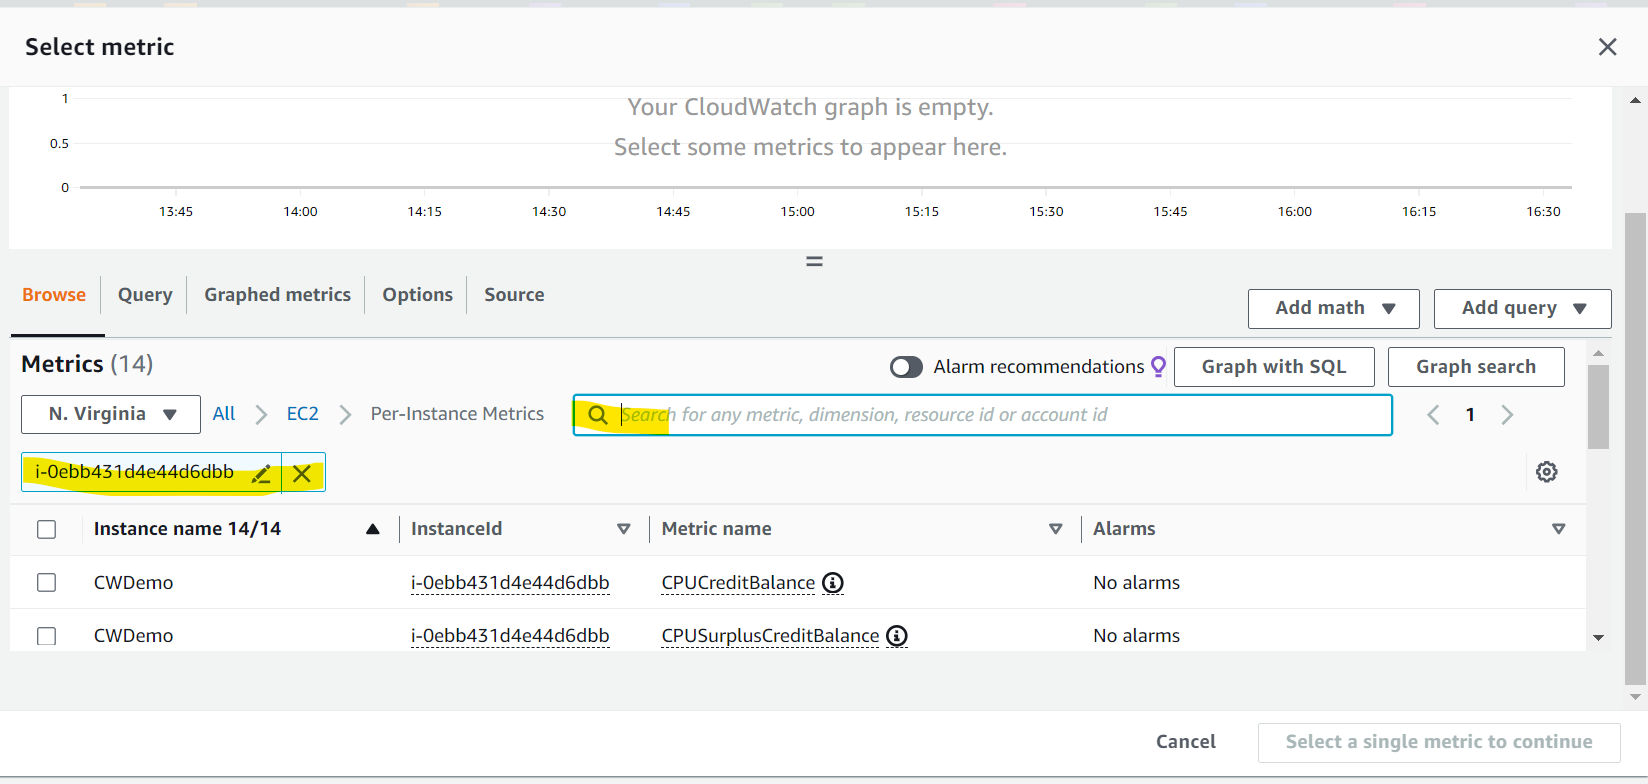
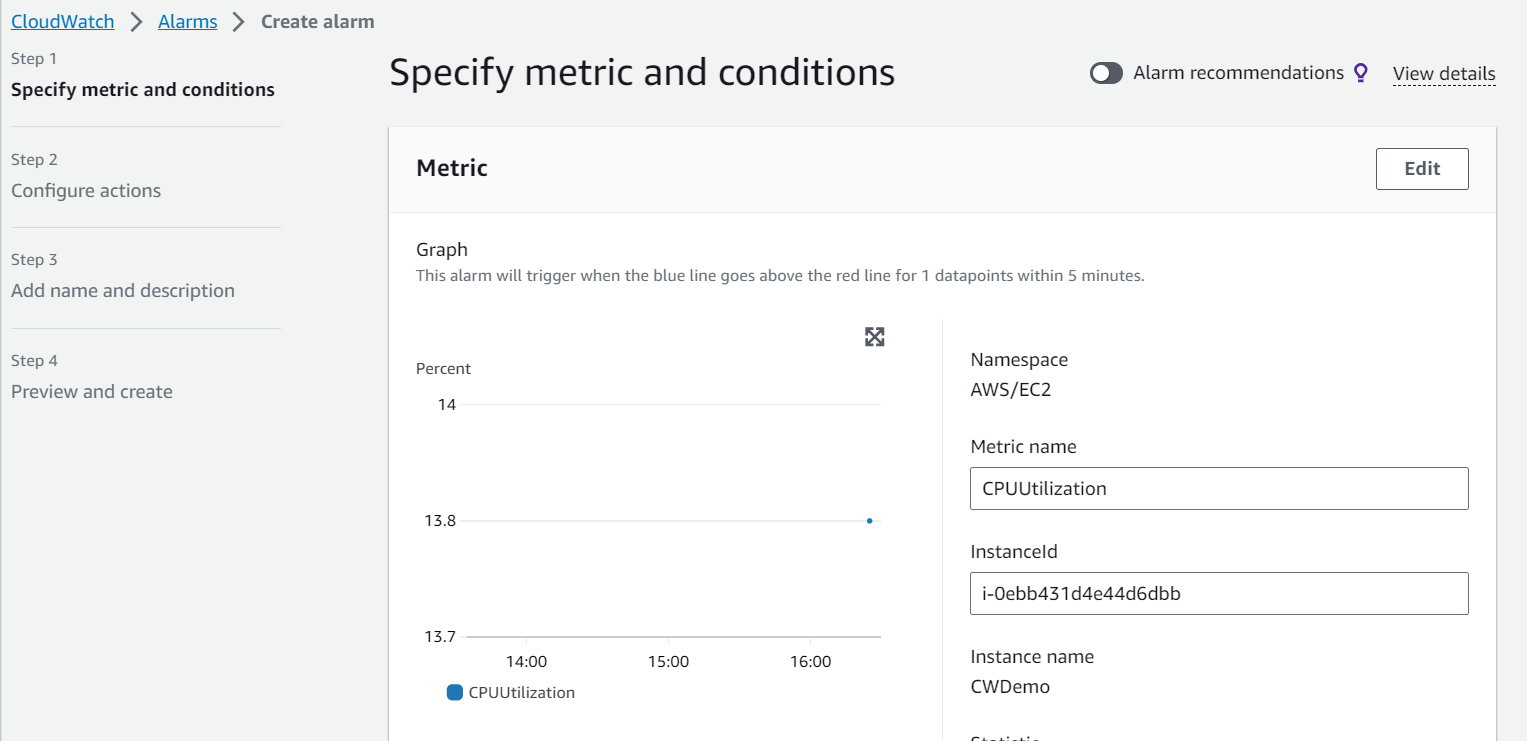
- Create Alarm
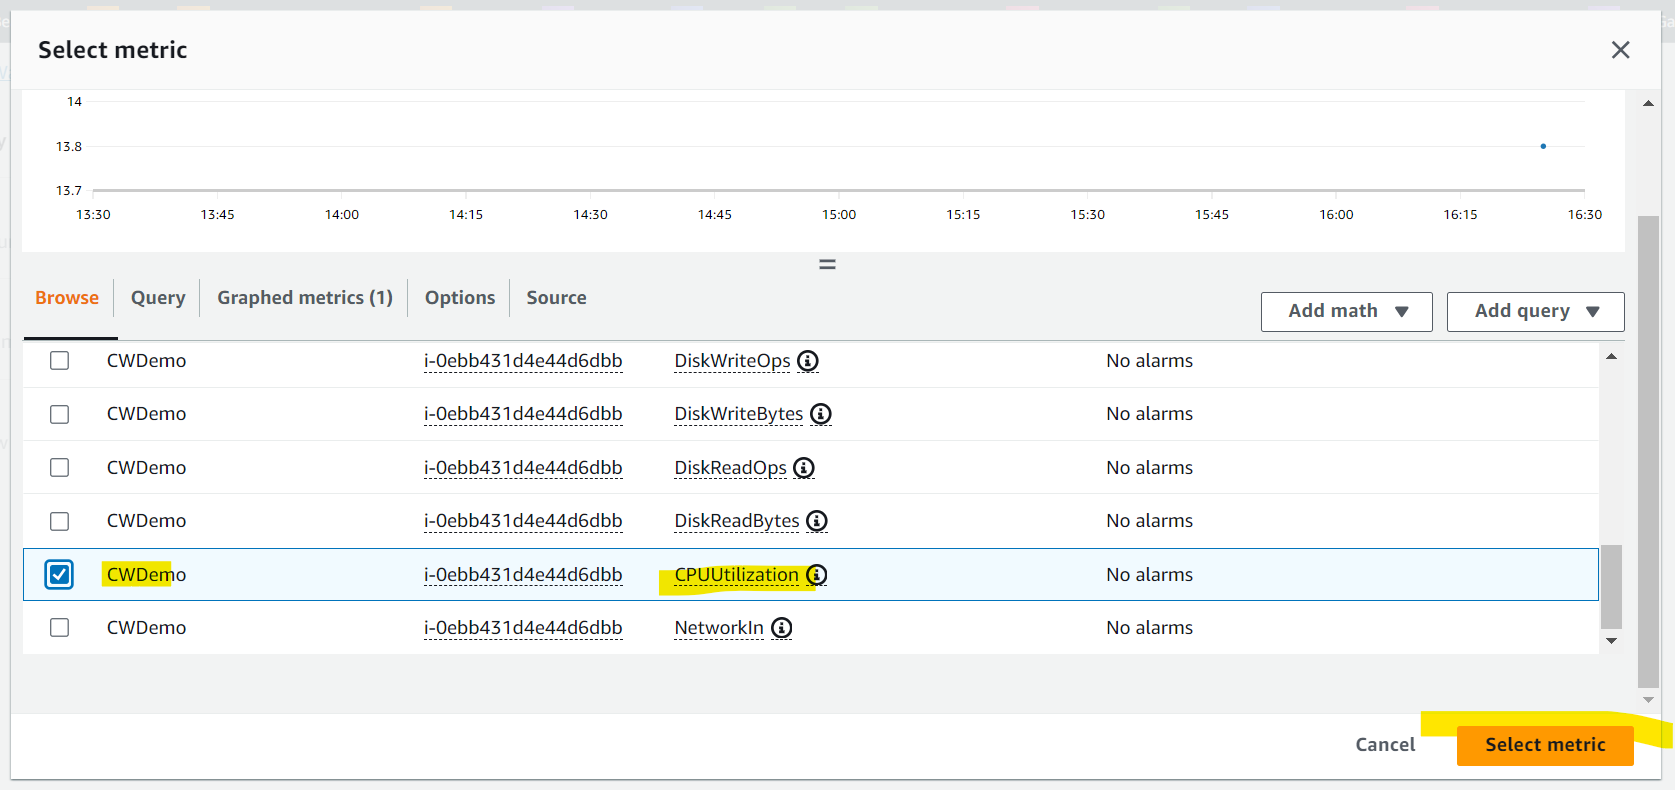
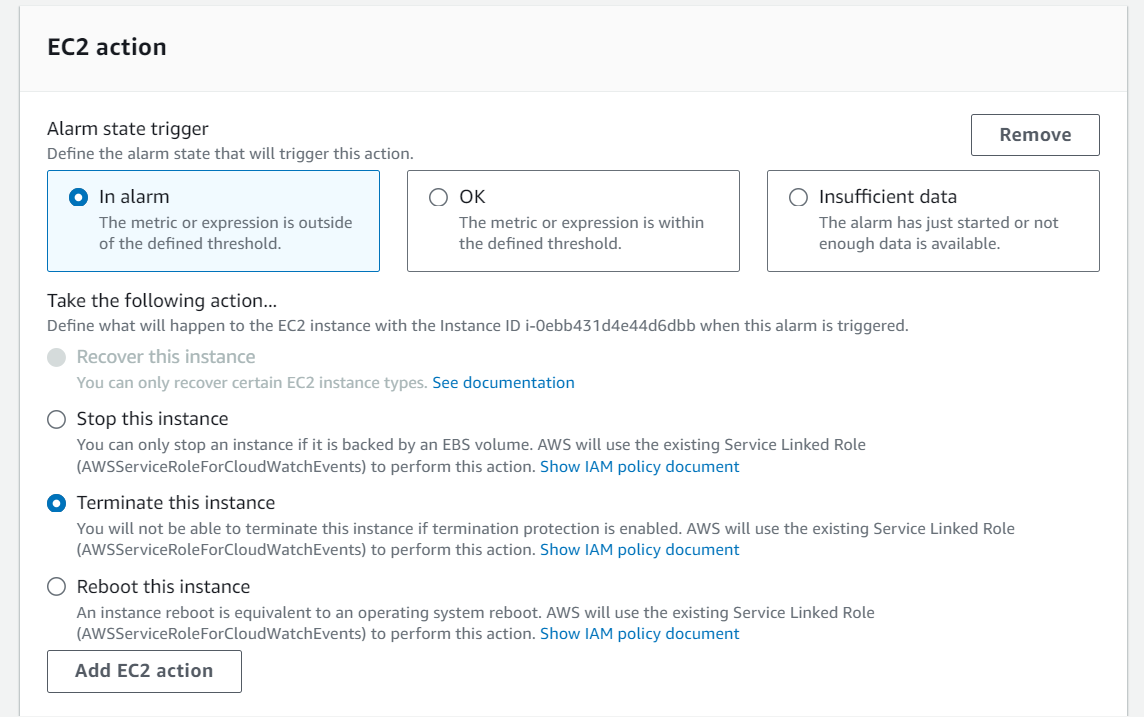
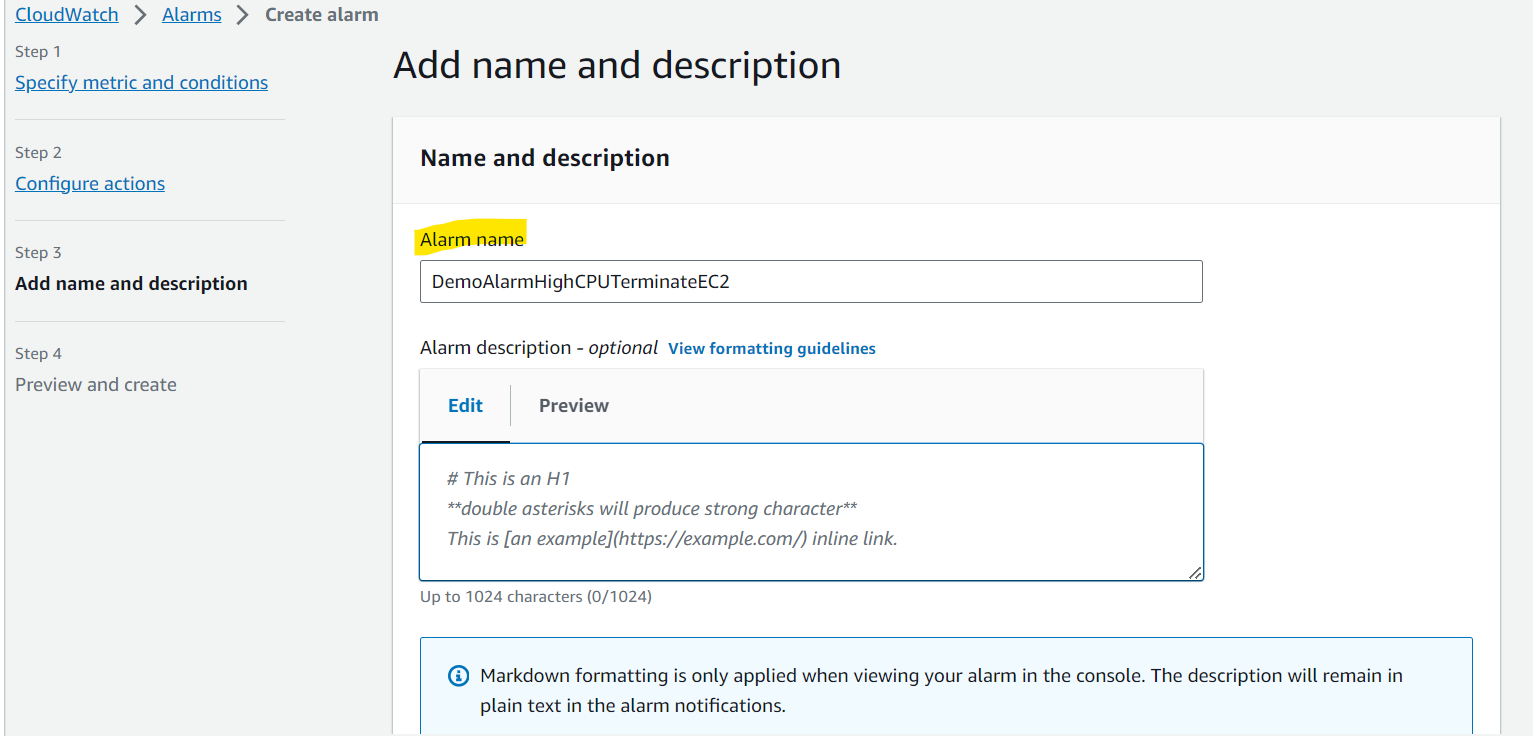
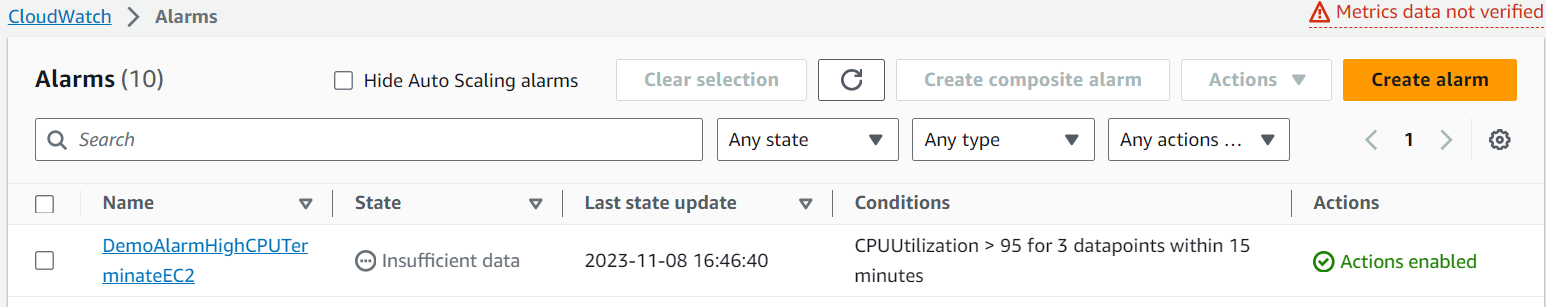
- Trigger Alarm manually
- EC2 terminated when alarm is triggered.
CloudWatch - Insights
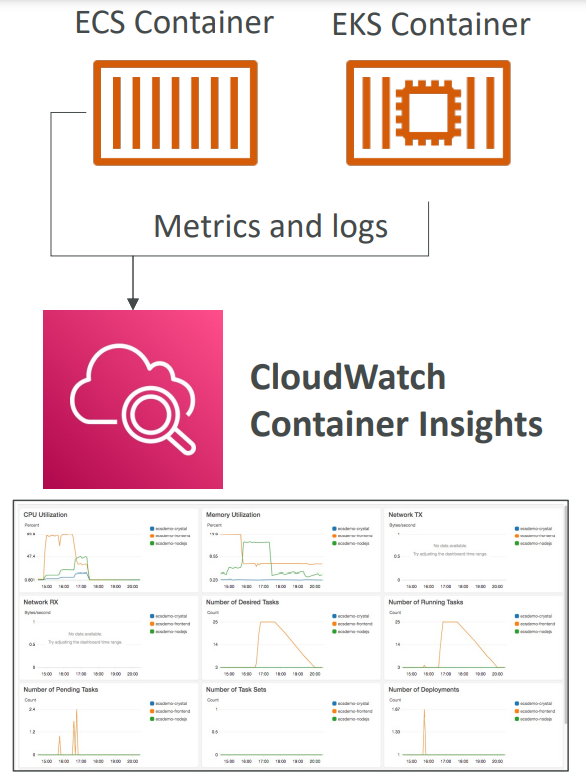
Container Insights
- Collect, aggregate, summarize metrics and logs from containers
-
Available for containers on…
Amazon Elastic Container Service(Amazon ECS)Amazon Elastic Kubernetes Services(Amazon EKS)Kubernetesplatforms onEC2Fargate(both forECSandEKS)
- In Amazon EKS and Kubernetes,
CloudWatch Insightsis using a containerized version of theCloudWatch Agentto discover containers.都是使用 Agent, 不过是 container 版本.
Lambda Insights
- Monitoring and troubleshooting solution for serverless applications running on AWS Lambda
- Collects, aggregates, and summarizes system-level metrics including CPU time, memory, disk, and network
- Collects, aggregates, and summarizes diagnostic information such as cold starts and Lambda worker shutdowns
- Lambda Insights is provided as a
Lambda Layer
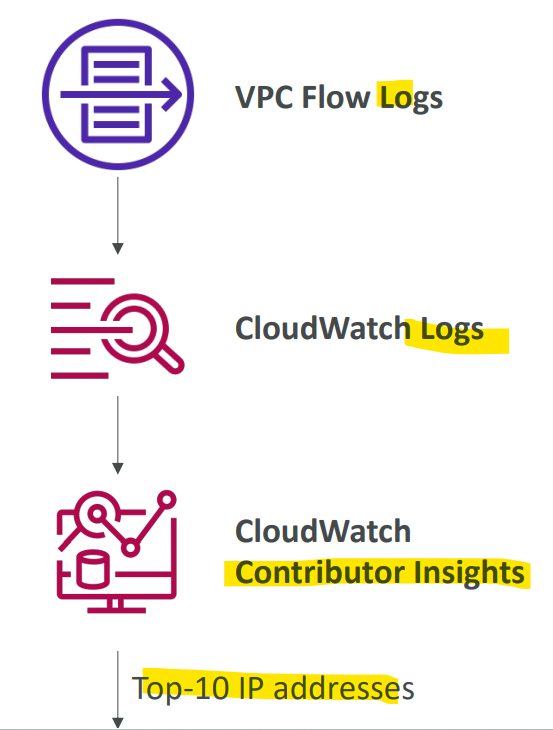
Contributor Insights
-
Analyze log data and create time series that display contributor data.
- See metrics about the top-N contributors
- The total number of unique contributors, and their usage.
- This helps you find top talkers and understand who or what is impacting system performance.
-
Works for any AWS-generated logs (VPC, DNS, etc..)
- ie, you can find bad hosts, identify the heaviest network users, or find the URLs that generate the most errors.
- Rules
- You can build your rules from scratch,
- you can also use sample rules that AWS has created – leverages your CloudWatch Logs
- CloudWatch also provides built-in rules that you can use to analyze metrics from other AWS services.
- Sample:
- A DevOps engineer is working for a company and managing its infrastructure and resources on AWS. There was a sudden spike in traffic for the main application for the company which was not normal in this period of the year. The application is hosted on a couple of EC2 instances in private subnets and is fronted by an Application Load Balancer in a public subnet. To detect if this is normal traffic or an attack, the DevOps engineer enabled the VPC Flow Logs for the subnets and stored those logs in CloudWatch Log Group. The DevOps wants to analyze those logs and find out the top IP addresses making requests against the website to check if there is an attack. Which of the following can help the DevOps engineer to analyze those logs?
- Cw Contributor Insights
- A DevOps engineer is working for a company and managing its infrastructure and resources on AWS. There was a sudden spike in traffic for the main application for the company which was not normal in this period of the year. The application is hosted on a couple of EC2 instances in private subnets and is fronted by an Application Load Balancer in a public subnet. To detect if this is normal traffic or an attack, the DevOps engineer enabled the VPC Flow Logs for the subnets and stored those logs in CloudWatch Log Group. The DevOps wants to analyze those logs and find out the top IP addresses making requests against the website to check if there is an attack. Which of the following can help the DevOps engineer to analyze those logs?
Application Insights
- Provides automated dashboards that show potential problems with monitored applications, to help isolate ongoing issues
- Your applications run on Amazon EC2 Instances with select technologies only (Java, .NET, Microsoft IIS Web Server, databases…)
- And you can use other AWS resources such as Amazon EBS, RDS, ELB, ASG, Lambda, SQS, DynamoDB, S3 bucket, ECS, EKS, SNS, API Gateway…
- Powered by
SageMakerinternally - Enhanced visibility into your application health to reduce the time it will take you to troubleshoot and repair your applications
- Findings and alerts are sent to Amazon
EventBridgeandSSM OpsCenter
Summary: CloudWatch Insights and Operational Visibility
-
CloudWatch
Container Insights- ECS, EKS, Kubernetes on EC2, Fargate, needs agent for Kubernetes
- Metrics and logs
-
CloudWatch
Lambda Insights- Detailed metrics to troubleshoot serverless applications
-
CloudWatch
Contributors Insights- Find “Top-N” Contributors through CloudWatch Logs
-
CloudWatch
Application Insights- Automatic dashboard to troubleshoot your application and related AWS services